Difference between revisions of "SMT201 AY2019-20T1 EX1 Zang Yu"
Jump to navigation
Jump to search

Yu.zang.2016 (talk | contribs) |
Yu.zang.2016 (talk | contribs) |
||
| Line 3: | Line 3: | ||
=== Distribution of public education institution by school types === | === Distribution of public education institution by school types === | ||
<br> [[File:Public education institution.png|800px|center]] <br> | <br> [[File:Public education institution.png|800px|center]] <br> | ||
| − | I have | + | Since the nature of the data is discrete, I have categorised the school layer into 4 categories based on the school types and symbolise them using different svg symbols. I used MP14 planning area layer as the background reference map to show the distribution of public education institutions across Singapore. |
| + | |||
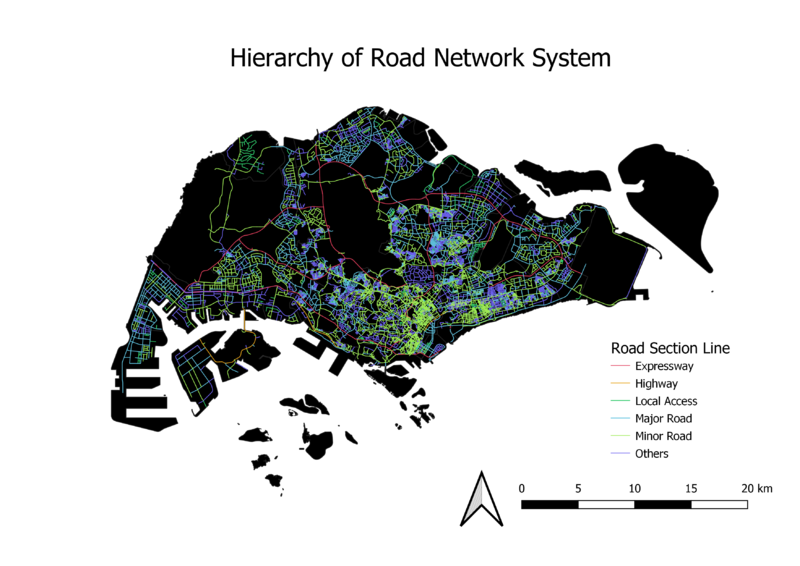
=== Road network system of Singapore === | === Road network system of Singapore === | ||
<br>[[File:Road network system.png|800px|center]] <br> | <br>[[File:Road network system.png|800px|center]] <br> | ||
Revision as of 10:35, 15 September 2019
Part 1: Thematic Mapping
Distribution of public education institution by school types

Since the nature of the data is discrete, I have categorised the school layer into 4 categories based on the school types and symbolise them using different svg symbols. I used MP14 planning area layer as the background reference map to show the distribution of public education institutions across Singapore.
Road network system of Singapore

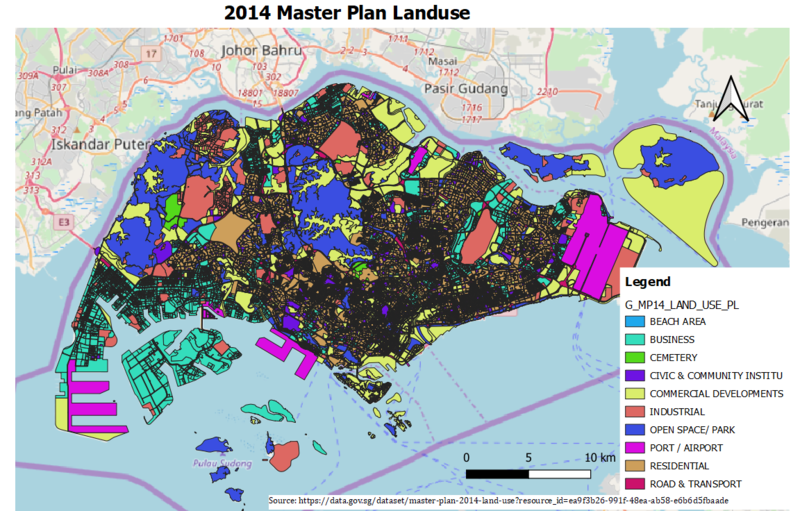
2014 Master Plan Landuse
