Difference between revisions of "Issho-ni Research Paper"
Jump to navigation
Jump to search
| Line 27: | Line 27: | ||
</div> | </div> | ||
<br> | <br> | ||
| − | ==<div style="background: #367a57; padding: 10px; font-weight: bold; line-height: 1em; text-indent: 15px; border-left: #BEB9B5 solid 32px; font-size: 20px"><font color="white"> | + | ==<div style="background: #367a57; padding: 10px; font-weight: bold; line-height: 1em; text-indent: 15px; border-left: #BEB9B5 solid 32px; font-size: 20px"><font color="white">Yishun Land Change Detection (2008 & 2014) </font></div>== |
<div style="border-left: #BEB9B5 solid 12px; padding: 0px 30px 0px 18px;"> | <div style="border-left: #BEB9B5 solid 12px; padding: 0px 30px 0px 18px;"> | ||
| − | === | + | === Yishun Boundary Change === |
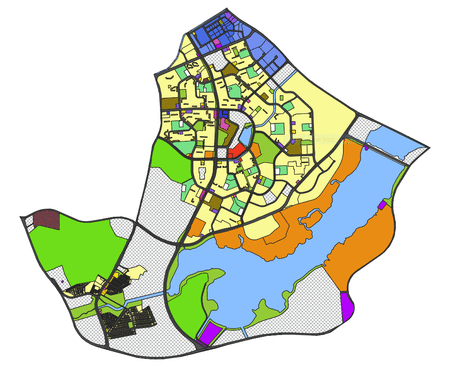
[[File:Yishun Boundary Change.png|900px|center]] | [[File:Yishun Boundary Change.png|900px|center]] | ||
From the map view above, we can see that Yishun's boundary has diminished a little, where the land has receded from the northeast direction. The subzones affected are namely Northland, Yishun East and Lower Seletar. | From the map view above, we can see that Yishun's boundary has diminished a little, where the land has receded from the northeast direction. The subzones affected are namely Northland, Yishun East and Lower Seletar. | ||
| − | === | + | === Yishun 2008 & 2014 Land Use === |
[[File:LandUse 08 Yishun.png|900px|center]] | [[File:LandUse 08 Yishun.png|900px|center]] | ||
[[File:LandUse 14 Yishun.png|900px|center]] | [[File:LandUse 14 Yishun.png|900px|center]] | ||
| − | === | + | === GIF Animation Depicting Land Use Changes === |
[[File:LandUse GIF.gif|450px|center]] | [[File:LandUse GIF.gif|450px|center]] | ||
</div> | </div> | ||
| − | ==<div style="background:#367a57; padding: 10px; font-weight: bold; line-height: 1em; text-indent: 15px; border-left: #BEB9B5 solid 32px; font-size: 20px"><font color="white"> | + | ==<div style="background:#367a57; padding: 10px; font-weight: bold; line-height: 1em; text-indent: 15px; border-left: #BEB9B5 solid 32px; font-size: 20px"><font color="white">Population Proportion of Targeted Age Groups </font></div>== |
<div style="border-left: #BEB9B5 solid 12px; padding: 0px 30px 0px 18px;"> | <div style="border-left: #BEB9B5 solid 12px; padding: 0px 30px 0px 18px;"> | ||
| Line 52: | Line 52: | ||
</div> | </div> | ||
| − | ==<div style="background: #367a57; padding: 10px; font-weight: bold; line-height: 1em; text-indent: 15px; border-left: #BEB9B5 solid 32px; font-size: 20px"><font color="white"> | + | ==<div style="background: #367a57; padding: 10px; font-weight: bold; line-height: 1em; text-indent: 15px; border-left: #BEB9B5 solid 32px; font-size: 20px"><font color="white">Land Suitability Modelling</font></div>== |
<div style="border-left: #BEB9B5 solid 12px; padding: 0px 30px 0px 18px;"> | <div style="border-left: #BEB9B5 solid 12px; padding: 0px 30px 0px 18px;"> | ||
{| class="wikitable" | {| class="wikitable" | ||
Revision as of 17:13, 11 November 2019
Project Report
Contents
Yishun Land Change Detection (2008 & 2014)
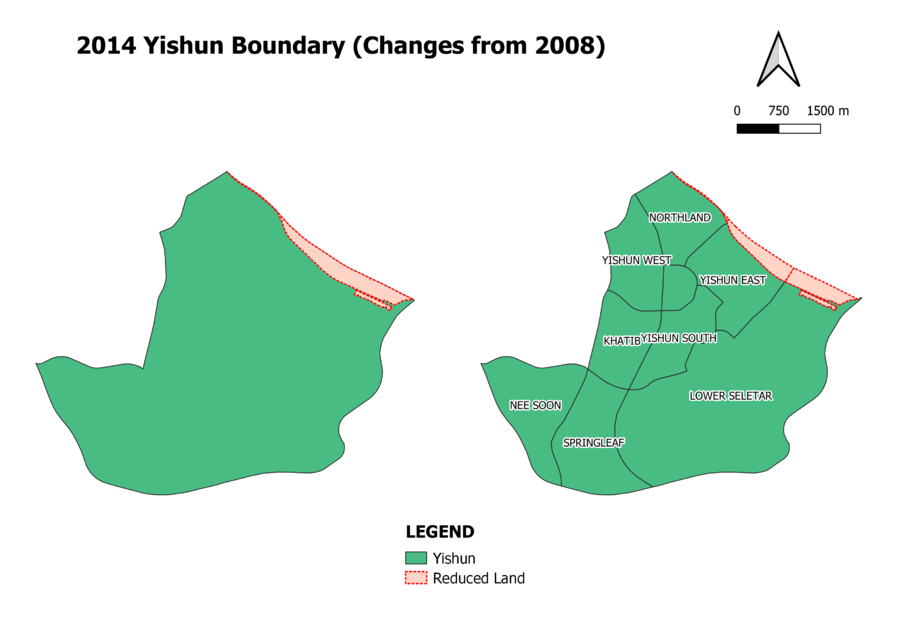
Yishun Boundary Change

From the map view above, we can see that Yishun's boundary has diminished a little, where the land has receded from the northeast direction. The subzones affected are namely Northland, Yishun East and Lower Seletar.
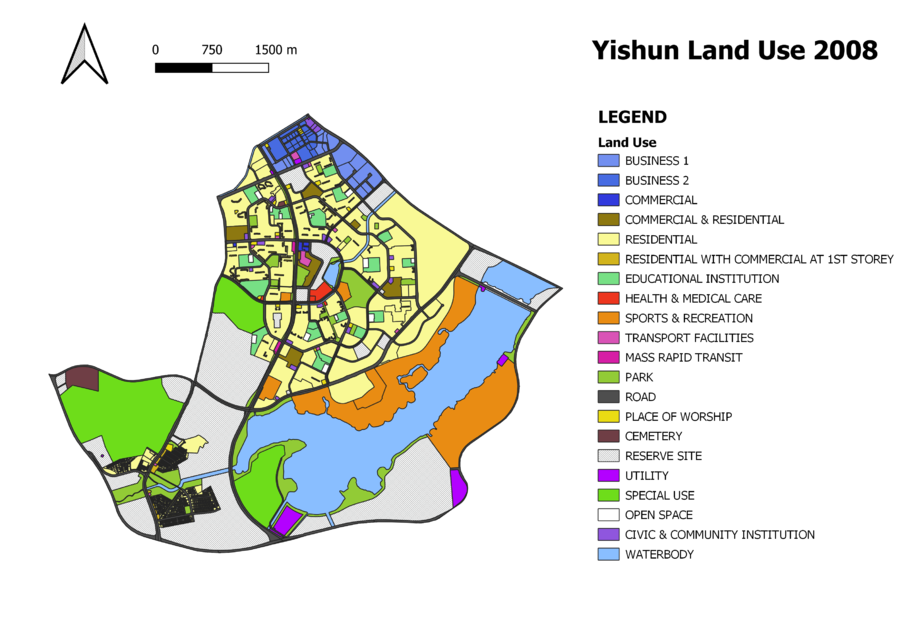
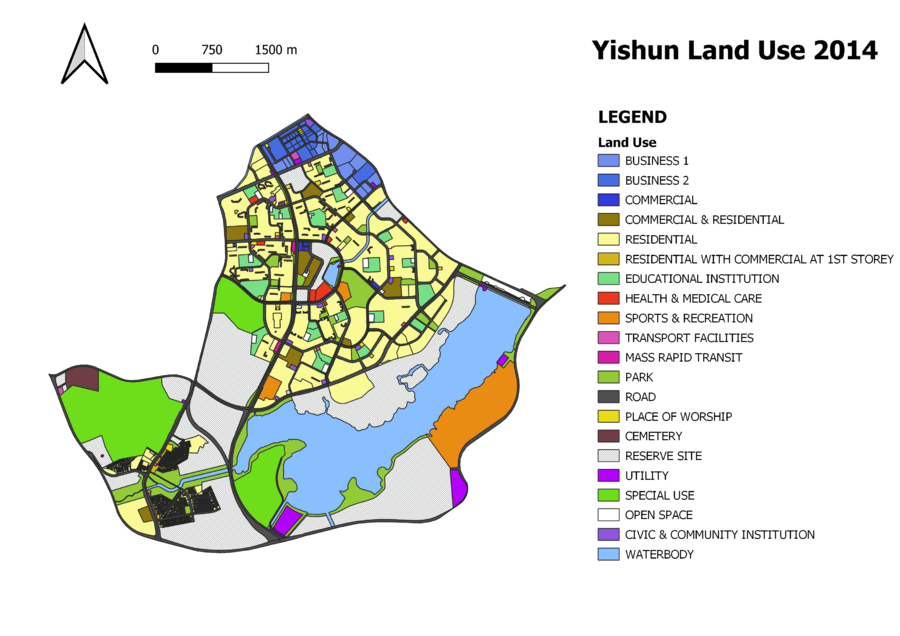
Yishun 2008 & 2014 Land Use


GIF Animation Depicting Land Use Changes

Population Proportion of Targeted Age Groups
we are dividing the population into 3 categories
- young
- Economic active
- senior
Land Suitability Modelling
Conclusion & Analysis
the ideal elderly service ..
[[File:|800px|left]]