Difference between revisions of "G1-Group10"
| (7 intermediate revisions by 2 users not shown) | |||
| Line 36: | Line 36: | ||
Leveraging on this fact, our group aims to digitalise the data and conduct in-depth analysis on each branch. We hope to track the performance of each chain in relation to Point-Of-Interests surrounding each chain, uncovering and comprehending phenomena, with the aid of spatial data. | Leveraging on this fact, our group aims to digitalise the data and conduct in-depth analysis on each branch. We hope to track the performance of each chain in relation to Point-Of-Interests surrounding each chain, uncovering and comprehending phenomena, with the aid of spatial data. | ||
| + | |||
| + | This project was made in tandem with: https://wiki.smu.edu.sg/1920t1is428g1/Two_Eyes_One_Pizza | ||
==<div style="background: #8b1209; padding: 15px; line-height: 0.3em; text-indent: 15px; font-size:18px; font-family:Helvetica"><font color= #FFFFFF>Objectives</font></div>== | ==<div style="background: #8b1209; padding: 15px; line-height: 0.3em; text-indent: 15px; font-size:18px; font-family:Helvetica"><font color= #FFFFFF>Objectives</font></div>== | ||
| Line 150: | Line 152: | ||
</center> | </center> | ||
|- | |- | ||
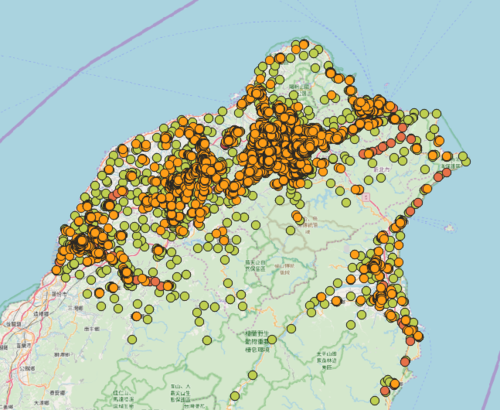
| − | | <center> Taiwan Stores </center> [[Image: | + | | <center> Taiwan Stores </center> [[Image: A6.png |500px|center]] || |
| − | * The client provided us a GeoPackage that contains information about each | + | * The client provided us a GeoPackage that contains information about each IFC Store |
<center> | <center> | ||
{| class="wikitable" | {| class="wikitable" | ||
| Line 213: | Line 215: | ||
</center> | </center> | ||
|- | |- | ||
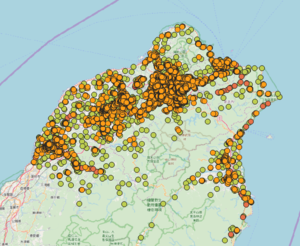
| − | | <center> POIs </center>[[Image: | + | | <center> POIs </center>[[Image: A6.png |300px|center]] || |
* The client provided us SHP files that contains information about each POI. We used 32 out of the 86 POI SHPs given. They are: | * The client provided us SHP files that contains information about each POI. We used 32 out of the 86 POI SHPs given. They are: | ||
# ATM | # ATM | ||
| Line 314: | Line 316: | ||
</center> | </center> | ||
|- | |- | ||
| − | | <center> Competitor POI’s </center> | + | | <center> Competitor POI’s </center> || |
* The client also provided us SHP files that contains information about each individual store from 5 clients. The data has the same attributes as POIs (refer to above), with an addition column: | * The client also provided us SHP files that contains information about each individual store from 5 clients. The data has the same attributes as POIs (refer to above), with an addition column: | ||
<center> | <center> | ||
| Line 324: | Line 326: | ||
|} | |} | ||
</center> | </center> | ||
| + | |||
| + | |||
|- | |- | ||
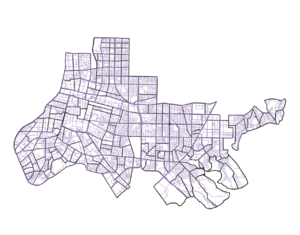
| − | + | | <center> Taiwan Road </center>[[Image: A7.png |300px|center]] || | |
| − | |||
| − | | <center> Taiwan Road </center>[[Image: | ||
* We obtained Taiwan Road SHP files online and managed to get it from mapcruzin.com. This was used in our shortest path analytical task. | * We obtained Taiwan Road SHP files online and managed to get it from mapcruzin.com. This was used in our shortest path analytical task. | ||
* Obtained from https://mapcruzin.com/free-taiwan-country-city-place-gis-shapefiles.htm | * Obtained from https://mapcruzin.com/free-taiwan-country-city-place-gis-shapefiles.htm | ||
| Line 355: | Line 357: | ||
|- | |- | ||
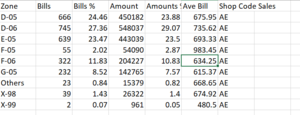
| − | | <center> Sales Data </center>[[Image: | + | | <center> Sales Data </center>[[Image: A8.png |300px|center]] || |
* The client gave us a CSV file containing yearly sales information of each region, further broken down into zone | * The client gave us a CSV file containing yearly sales information of each region, further broken down into zone | ||
| Line 380: | Line 382: | ||
|- | |- | ||
| − | | <center> Population Data </center> | + | | <center> Population Data </center> || |
* We obtained population data with regards to Taiwan online. The XLS file contains population Data is from the year 2010 and is in, uncleaned table format XLS. This was used as an addition feature in our analysis. | * We obtained population data with regards to Taiwan online. The XLS file contains population Data is from the year 2010 and is in, uncleaned table format XLS. This was used as an addition feature in our analysis. | ||
* Obtained from https://census.dgbas.gov.tw/PHC2010/english/rehome.htm | * Obtained from https://census.dgbas.gov.tw/PHC2010/english/rehome.htm | ||
| Line 401: | Line 403: | ||
|} | |} | ||
</center> | </center> | ||
| + | |- | ||
| + | |} | ||
==<div style="background: #8b1209; padding: 15px; line-height: 0.3em; text-indent: 15px; font-size:18px; font-family:Helvetica"><font color= #FFFFFF>Foreseen Technical Challenges</font></div>== | ==<div style="background: #8b1209; padding: 15px; line-height: 0.3em; text-indent: 15px; font-size:18px; font-family:Helvetica"><font color= #FFFFFF>Foreseen Technical Challenges</font></div>== | ||
| Line 493: | Line 497: | ||
==<div style="background: #8b1209; padding: 15px; line-height: 0.3em; text-indent: 15px; font-size:18px; font-family:Helvetica"><font color= #FFFFFF>Project Schedule</font></div>== | ==<div style="background: #8b1209; padding: 15px; line-height: 0.3em; text-indent: 15px; font-size:18px; font-family:Helvetica"><font color= #FFFFFF>Project Schedule</font></div>== | ||
| − | + | Project Gantt chart: | |
| − | + | [[File:Ganttgantt.png|1200px|none]] | |
| − | [[ | ||
==<div style="background: #8b1209; padding: 15px; line-height: 0.3em; text-indent: 15px; font-size:18px; font-family:Helvetica"><font color= #FFFFFF>References</font></div>== | ==<div style="background: #8b1209; padding: 15px; line-height: 0.3em; text-indent: 15px; font-size:18px; font-family:Helvetica"><font color= #FFFFFF>References</font></div>== | ||
Latest revision as of 02:10, 22 November 2019
Contents
Introduction & Motivation
International Food Chain (IFC) is a leading brand in its sector, with over 18000 outlets worldwide and an ever-growing presence in the global market. In Taiwan alone, IFC has over 240 branches and are constantly expanding.
However, as the franchise grows bigger, so does its challenges. One of the challenges involves the lack of a geographical analysis to efficiently compare the performance of each chain to one another.
Leveraging on this fact, our group aims to digitalise the data and conduct in-depth analysis on each branch. We hope to track the performance of each chain in relation to Point-Of-Interests surrounding each chain, uncovering and comprehending phenomena, with the aid of spatial data.
This project was made in tandem with: https://wiki.smu.edu.sg/1920t1is428g1/Two_Eyes_One_Pizza
Objectives
This project aims to provide insights into the following:
- Missing Areas in trade zone
- Number of POIs surrounding each store
- Store performance with regards to sales
- Delivery Information
- Population Density
- Buffer and proximity
- Nearest Competitors to store
- Variable importance based on regression analysis
Tools and Libraries
The following tools and libraries are used in the digitisation and analysis:
- QGIS
- Excel
- Python
Datasets
Datasets Provided:
| Dataset | Rationale | |||||||||||||||||||||||||||||||||||||||||||||||||||||||||||||||||||||||||||||||||||||||||||||
|---|---|---|---|---|---|---|---|---|---|---|---|---|---|---|---|---|---|---|---|---|---|---|---|---|---|---|---|---|---|---|---|---|---|---|---|---|---|---|---|---|---|---|---|---|---|---|---|---|---|---|---|---|---|---|---|---|---|---|---|---|---|---|---|---|---|---|---|---|---|---|---|---|---|---|---|---|---|---|---|---|---|---|---|---|---|---|---|---|---|---|---|---|---|---|
| ||||||||||||||||||||||||||||||||||||||||||||||||||||||||||||||||||||||||||||||||||||||||||||||
| ||||||||||||||||||||||||||||||||||||||||||||||||||||||||||||||||||||||||||||||||||||||||||||||
| ||||||||||||||||||||||||||||||||||||||||||||||||||||||||||||||||||||||||||||||||||||||||||||||
| ||||||||||||||||||||||||||||||||||||||||||||||||||||||||||||||||||||||||||||||||||||||||||||||
| ||||||||||||||||||||||||||||||||||||||||||||||||||||||||||||||||||||||||||||||||||||||||||||||
| ||||||||||||||||||||||||||||||||||||||||||||||||||||||||||||||||||||||||||||||||||||||||||||||
| ||||||||||||||||||||||||||||||||||||||||||||||||||||||||||||||||||||||||||||||||||||||||||||||
| ||||||||||||||||||||||||||||||||||||||||||||||||||||||||||||||||||||||||||||||||||||||||||||||
| ||||||||||||||||||||||||||||||||||||||||||||||||||||||||||||||||||||||||||||||||||||||||||||||
|
Foreseen Technical Challenges
We encountered the following technical challenges throughout the course of the project. We have indicated our proposed solutions, and the outcomes of the solutions.
| Key Technical Challenges | Proposed Solution | Outcome |
|---|---|---|
|
NA | |
|
We managed to start using the languages quickly and suit our own project needs. Each of us work on different parts such as setting up, designing, logic and deployment. This speeds up our project progress. | |
|
The adopted process was having clear instructions issued to each member in the team, along with maintaining constant communication with each other. In the event that the dataset is deemed too dirty to be usable, it was dropped along with sourcing for new data that would be a suitable replacement. | |
|
NA | |
|
The data points can better allow us to generate insights on the profile of each outlet via its trade area. | |
|
NA |
Scope of work
- Roles
| Kelvin Chia Sen Wei | Linus Cheng Xin Wei | Eugene Choy Wen Jie |
|---|---|---|
Data Cleaner in Python |
Project Manager |
Data Cleaner in Excel |
Project Schedule
Project Gantt chart:
References
- Project Page: https://wiki.smu.edu.sg/1920t1smt201/GIS_Project
- Python Pandas: https://pandas.pydata.org/
- Tableau: https://www.tableau.com/learn/training
- QGIS: http://www.qgistutorials.com/en/
Comments
Feel free to leave comments / suggestions!

