Difference between revisions of "G2-Group13"
Lhkhong.2018 (talk | contribs) |
Lhkhong.2018 (talk | contribs) |
||
| Line 57: | Line 57: | ||
[[File:Stores.png|450px|thumb|left]] | [[File:Stores.png|450px|thumb|left]] | ||
| + | |||
| + | |||
| + | |||
| + | |||
| + | |||
| + | |||
| + | |||
| + | |||
| + | |||
| + | |||
| + | |||
| + | |||
| + | |||
Revision as of 15:56, 9 November 2019
Project Motivation
Our client is a well-established in the food and beverage (F&B) industry internationally and has multiple shop outlets across Taiwan and would like us to find out the reasons for the difference in sales figures for different franchised outlets, whether factors like nearby presence of entertainment or presence of other food and beverage outlets would affect their sales.
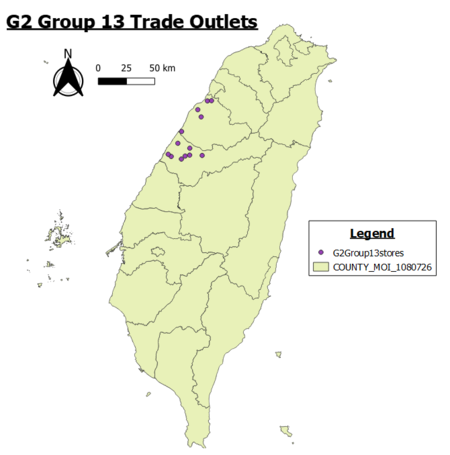
To understand more about the assigned food outlets given to us, we researched on the background information of Miaoli and Taichung to find out more about the geological map of both Miaoli and Taichung.
Miaoli County is a county in the mid-northern cost of western Taiwan and has a population of 548,863 in the whole county. Miaoli City is the capital of the county and known as ‘Mountain Town’ due to the the number of mountains nearby. Miaoli is roughly diamond-shaped in appearance and the overall coastline of Miaoli is 54km long. (https://en.wikipedia.org/wiki/Miaoli_County)
Taichung is a special municipality in central Taiwan with a population of approximately 2.81million and is Taiwan’s 2nd most populated city. It is the core of Taichung-Changhua metropolitan area, which is the second largest in Taiwan. Taichung was formed when Taichung County merged with the provincial Taichung City to form the special municipality in 2010. Taichung has a land area of 2,21490km^2 and the Central Mountain Range lies just to the east of the city and the hills roll up to the north leading to Miaoli County. (https://en.wikipedia.org/wiki/Taichung).
Project Objective
Given the 13 outlets assigned to us and to achieve our project objectives, the team has decided to do the following: 1) Digitalize the map of trade areas pointed out by client 2) Delineate trade area 3) Set buffers of 2.5km, 3km and 3.5km for each trade area 4) Extract various Point of Interests (POI) within the trade area and within the buffers 5) Build a network data model around the trade areas. 6) Run Multiple Linear Regression (MLR) on the 3 buffer layers, original trade area and network analysis 7) Analyzing of MLR results to see how presence of POI can affect sales 8) Creating Poster 9) Creating of Project Report and Project Artefacts
Data
Scope of Work


