G2-Group13

Our client is well-established in the food and beverage (F&B) industry internationally and has multiple shop outlets across Taiwan. They are looking to improve their bottom line and would like us to explain the reasons for the difference in sales figures for different franchised outlets, whether factors like nearby presence of entertainment or presence of other food and beverage outlets would affect their sales. Currently, their trade area is done using sketches on maps and cuts through rivers and forested areas. However, as the hand-drawn trade area is static in nature, our client is unable to create any further analysis on their own. Thus, we aim to digitalize their hand-drawn trade areas for further analysis of our client's trade area based on their outlets using Points of Interests (POIs). Our client is looking to maximise their profitability in their franchise outlets by looking into their various trade areas and to determine the best model that can explain the sales performance.
To understand more about the assigned food outlets given to us, we researched on the background information of Miaoli and Taichung to find out more about the geological map of both Miaoli and Taichung.
Miaoli County is a county in the mid-northern cost of western Taiwan and has a population of 548,863 in the whole county. Miaoli City is the capital of the county and known as ‘Mountain Town’ due to the the number of mountains nearby. Miaoli is roughly diamond-shaped in appearance and the overall coastline of Miaoli is 54km long. (https://en.wikipedia.org/wiki/Miaoli_County)
Taichung is a special municipality in central Taiwan with a population of approximately 2.81million and is Taiwan’s 2nd most populated city. It is the core of Taichung-Changhua metropolitan area, which is the second largest in Taiwan. Taichung was formed when Taichung County merged with the provincial Taichung City to form the special municipality in 2010. Taichung has a land area of 2,21490km^2 and the Central Mountain Range lies just to the east of the city and the hills roll up to the north leading to Miaoli County. (https://en.wikipedia.org/wiki/Taichung).
Through this project, we aim to:
- Digitalised our client’s current trade areas and provide them back with digitalised trade area maps in QGIS which they can conduct their own analysis with
- Analyse possible other delineated trade areas that our client can possibly consider
- Provide a Multiple Linear Regression (MLR) Model that can best explains the sales performance within Miaoli County and Taichung city
- Create and provide web-based maps that our client can conduct further visualisations without needing to have QGIS installed
The following datasets have been provided by Professor Kam, alongside our client.
| Data Folder Name | Data Format | Data Source | Purpose |
|---|---|---|---|
Admin Boundary
|
Shapefile | Client/Prof Kam | To know outline of Counties, Towns and Villages of Taiwan |
Places of Interest (POI) in Taiwan
|
Shapefile | Client/Prof Kam | To know different types of Places of Interest (POI) in Taiwan |
| Map Releases - Taiwan Release Notes | Client/Prof Kam | Identify the POI based on facility code | |
| Location Map (13 Trade Areas) | PowerPoint Slides | Client/Prof Kam | To know rough guide of trade area of franchise outlets in Taiwan for team to digitalize |
| GeoPackage (Taiwan Stores) | Geopackage | Client/Prof Kam | Provides outlet location of Franchise Stores |


- Digitalising Current hand-drawn maps
- Extracting out the 13 outlets within our project scope
- Digitalised client's current trade areas with OpenStreetMap as the backdrop
- Merged all 13 different outlet's digitalised trade area into a single vector layer
- Checking for errors (overlaps, gaps, silver polygons) on the merged single vector layer
- Data Cleaning for POI attributes, store sales data
- Removing duplicated data entries within each POI attribute layer
- Aggregating the total revenue amount earned by each store
- Delineated other possible trade areas
- Buffer distance trade area delineation (2.5km, 3km, 3.5km) with Buffer function
- Service area trade area delineation through road network analysis with OpenOSM and QNEAT3 plugins
- Capturing the data points that fall within each delineated trade area
- Count point in polygon feature
- Multiple Linear Regression (MLR) for modelling (performed in R, repeated five times for five different delineated trade areas)
- Variables Categorisation for Predictor Variables
- Checking for linear relationship between Dependent Variable and Independent Variables
- Multicollinearity check between remaining Independent Variables
- MLR modelling in R
Below are the best MLR model output for the buffer distance delineated trade areas:
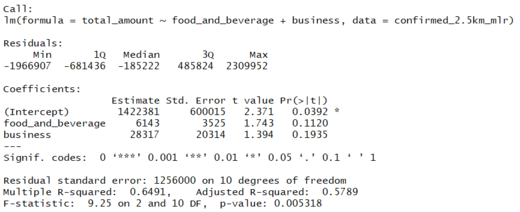
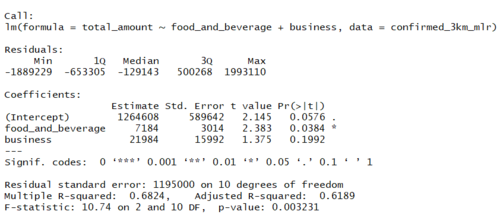
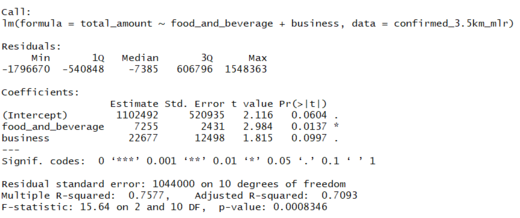
Across the three MLR outputs for our buffer distance delineated trade area, 3.5km buffer distance trade area has the highest adjusted R^2 value (0.7093). We will then use 3.5km buffer distance trade area to compare with the two other delineated trade areas - currently delineated trade area and service area trade area.
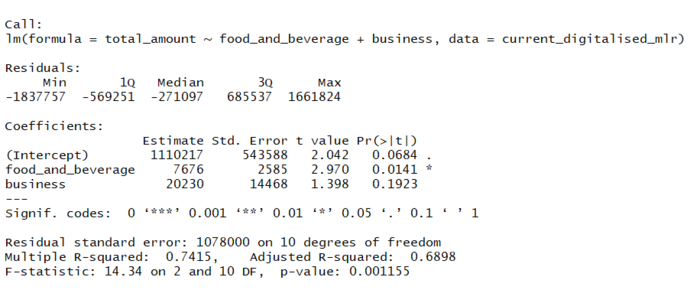
Comparing between 3.5km buffer distance trade area, currently delineated trade area and service area trade area, we see that 3.5km buffer distance trade area has the highest adjusted R^2 value among the three delineated trade areas. Also, all three variables (intercept, food_and_beverage, business) are significant at 90% CI. Hence, we conclude that 3.5km buffer distance trade area is the best delineated trade area that helps to explain sales performance of outlets across Miaoli and Taichung County. We recommend for our client to switch from their current trade area to 3.5km buffer distance trade area.
To find a more in-depth analysis of our project, you can find and download our report from the 'Project Report' tab.
Ryan
I have learnt a lot during this course and project which I believe will be useful down the road. For instance, being able to conduct geospatial visualization and analysis through the use of open source geographic information software (QGIS) and being able to incorporate scripting languages to implement processes like geocoding will come in handy in future projects as it enables us to help users to visualise the data points on a map. The end to end process in this project was highly beneficial in my learning too. It helped me to understand the importance of understanding the data given and what it represents, how much effort it took to clean the data, as well as the many different approaches one could take to resolve the same problem, by using different functions and methodologies, and it is up to us to choose the most optimal solution and to analyse the pros and cons of each solution.
Rachel
This was a very interesting project for me given that I’m interested in the field of Geospatial Visualisation. I enjoyed the project thoroughly with the skills learnt throughout the semester, being able to understand QGIS much better with the skills learnt. The allocation of work during this project can’t be easily split just like any other typical project, we had to understand our data and how our splitting of workload would have a consequence on our results.
Jia Khee
I thoroughly enjoyed working on this project, especially so after having the chance to work with actual industry data, something that we do not often get a chance to do as undergraduates. This project helped strengthened and reinforced some geospatial concepts that I very much foresee myself work on after graduation. Big thank you to Rachel and Ryan who were amazing team players to have helped brought to life the various components of the project!
