Difference between revisions of "Three horrible guys Poster"
| Line 47: | Line 47: | ||
<br/> | <br/> | ||
In the above figure, we do see buildings that are not in any trade area. Therefore, this uncovered area may have been omitted and should be fulfilled by one of the branches. | In the above figure, we do see buildings that are not in any trade area. Therefore, this uncovered area may have been omitted and should be fulfilled by one of the branches. | ||
| + | ==<div style="background: #8b1209; padding: 15px; line-height: 0.3em; text-indent: 15px; font-size:18px; font-family:Helvetica"><font color= #FFFFFF>1. Missing Area Analysis</font></div>== | ||
| + | <div style="font-family:Helvetica;font-size:16px"> | ||
| + | The yearly store sales of Pizza Hut located in Taiwan range from USD$6,809,445 - $13,863,637, with the branch YT being the lowest, and the branch MA having the highest sales. The median sales is branch SS, with USD$9597893.5 | ||
| + | [[File:q3.png|400px|center]] | ||
| + | <center>''Overall Store sales''</center> | ||
| + | <br/> | ||
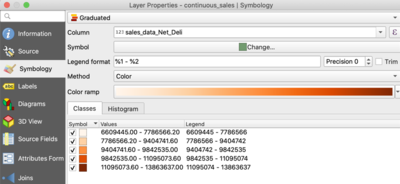
| + | From the sales data that we have extracted and populated into the geopackage layer, we can then plot these data on the map for each store. It has been split into 5 classes of Quantile (Equal Count). Below is an illustration of the classes and histogram: | ||
| + | [[File:q4.png|400px|center]] | ||
| + | <center>''Symbology settings for overall sales''</center> | ||
| + | <br/> | ||
Revision as of 19:17, 22 November 2019
1. Missing Area Analysis
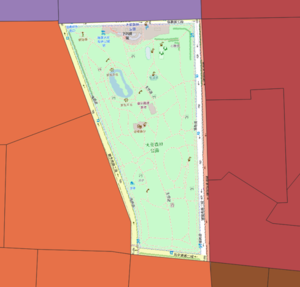
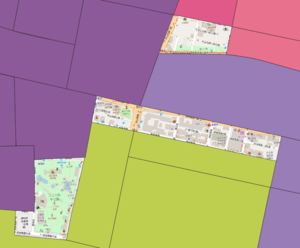
As we observe the generated trade areas, it seems there are some areas which are not covered by any of the branches. Hence, we decided to analyse these areas.
In the above figure, the uncovered area is 大安森林公园 which is a park. As it is not common to order a pizza to a park, being uncovered is to be expected.
In the above figure, we do see buildings that are not in any trade area. Therefore, this uncovered area may have been omitted and should be fulfilled by one of the branches.
1. Missing Area Analysis
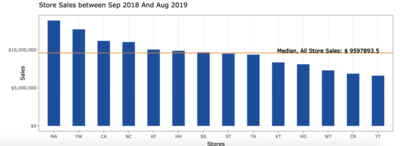
The yearly store sales of Pizza Hut located in Taiwan range from USD$6,809,445 - $13,863,637, with the branch YT being the lowest, and the branch MA having the highest sales. The median sales is branch SS, with USD$9597893.5
From the sales data that we have extracted and populated into the geopackage layer, we can then plot these data on the map for each store. It has been split into 5 classes of Quantile (Equal Count). Below is an illustration of the classes and histogram:
