Difference between revisions of "SMT201 AY2019-20T1 EX1 Lee Wan Ning"
Jump to navigation
Jump to search
| Line 5: | Line 5: | ||
<br> | <br> | ||
<br> | <br> | ||
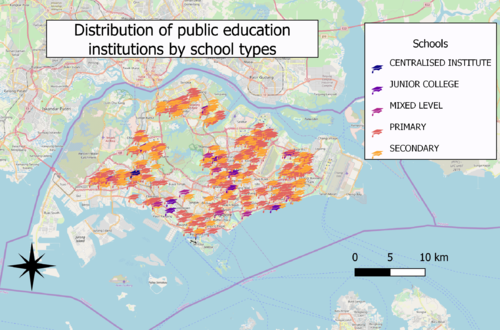
| − | + | [[File:Distribution of public education institutions by school type.png|500px|thumb|left|A:Distribution of public education institutions by school type]]<br> | |
| − | Distribution of public education institutions by school type.png|500px|thumb|left|A:Distribution of public education institutions by school type | ||
| − | |||
<br> | <br> | ||
''Choice of classification:''<br> | ''Choice of classification:''<br> | ||
| − | categorisation by school types | + | categorisation by school types<br> |
''Visual variable:'<br> | ''Visual variable:'<br> | ||
using an SVG marker of a graduation hat as symbol<br> | using an SVG marker of a graduation hat as symbol<br> | ||
Revision as of 10:59, 15 September 2019
Part 1:Thematic Mapping
A: Distribution of public education institution by school types
Choice of classification:
categorisation by school types
Visual variable:'
using an SVG marker of a graduation hat as symbol
Reason:
School types is a qualitative variable with nominal scale, SVG marker more relevant to the context of education institutions
Observation:
Generally, there are more secondary and primary schools than that of centralised institute mixed levels education institutions and junior colleges. Generally, there are more education institutions congregated near the East and North-East region
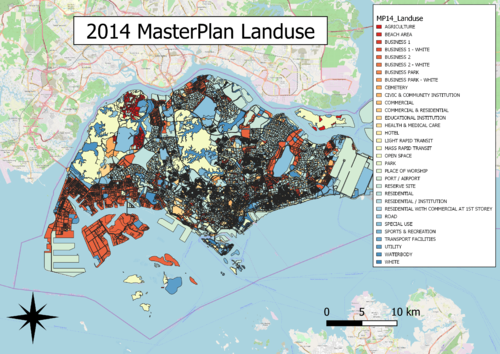
C:2014 Master Plan Landuse
Part 2:Choropleth Mapping
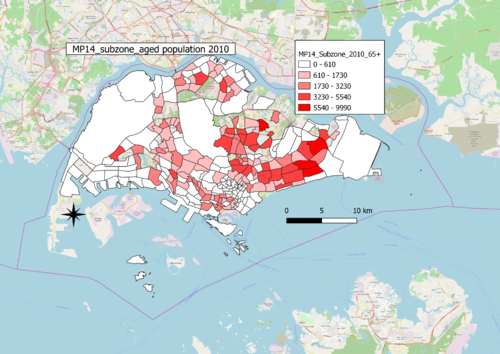
A: Aged population in 2010 and 2018
B: Aged population proportion in 2010 and 2018
C: Percentage change of Aged population between 2010 and 2018
Credits
- Data.gov.sg


