Difference between revisions of "Issho-ni Research Paper"
| Line 50: | Line 50: | ||
<div style="border-left: #BEB9B5 solid 12px; padding: 0px 30px 0px 18px;"> | <div style="border-left: #BEB9B5 solid 12px; padding: 0px 30px 0px 18px;"> | ||
| − | + | === Demographic Segmentation === | |
| − | + | We have divided the population into 3 categories: | |
| − | + | * Young (0 - 24 years old) | |
| − | + | * Economic Active (25 - 64 years old) | |
| + | * Aged (65 and above) | ||
| + | |||
| + | === Population Change for the Segments === | ||
| + | We have obtained the census/household data from SingStat to analyse the population change between 2008 and 2014 for each target segment identified above. Due to unavailability of the desired information (2008 and 2014), we have used the Basic Demographic Characteristics data for year 2010 and 2015 respectively, which closely follows the timeframe in study. | ||
| + | |||
| + | From the downloaded Excel sheets, we have extracted information relevant to our analysis (i.e. Yishun's population) and cleaned up the data necessarily before saving into separate CSV files ready to be used in QGIS as attribute tables. For instance, the 2010 does not include Nee Soon as part of the subzones of Yishun's population data while the 2015 does. Upon further scrutiny, we realised it was SingStat's decision to omit planning areas/subzones with small number of persons, and that Nee Soon did exist at the year of 2010. Hence, we added in Nee Soon in our 2010 CSV file but with 0's imputed for the population. | ||
| + | |||
| + | ==== Population Change (Young) ==== | ||
| + | [[File:Yishun Population Change (Young, Percentage).png|800px|center]] | ||
| + | |||
| + | ==== Population Change (Economic Active) ==== | ||
| + | [[File:Yishun Population Change (Econ, Percentage).png|800px|center]] | ||
| + | |||
| + | ==== Population Change (Aged) ==== | ||
| + | [[File:Yishun Population Change (Aged, Percentage).png|800px|center]] | ||
| + | |||
</div> | </div> | ||
Revision as of 15:38, 12 November 2019
Contents
Yishun Land Change Detection (2008 & 2014)
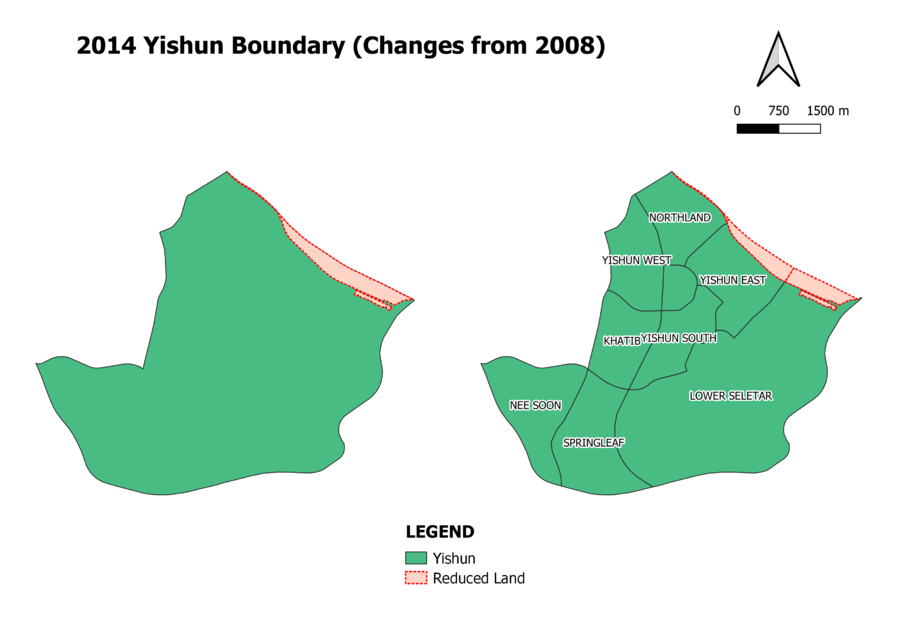
Yishun Boundary Change
From the map view above, we can see that Yishun's boundary has diminished a little, where the land has receded from the northeast direction. The subzones affected are namely Northland, Yishun East and Lower Seletar.
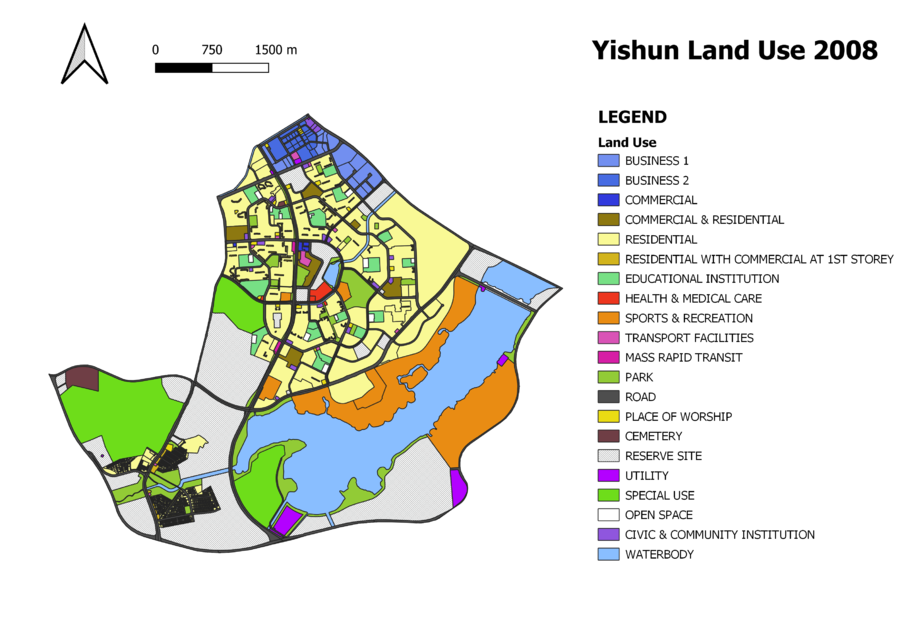
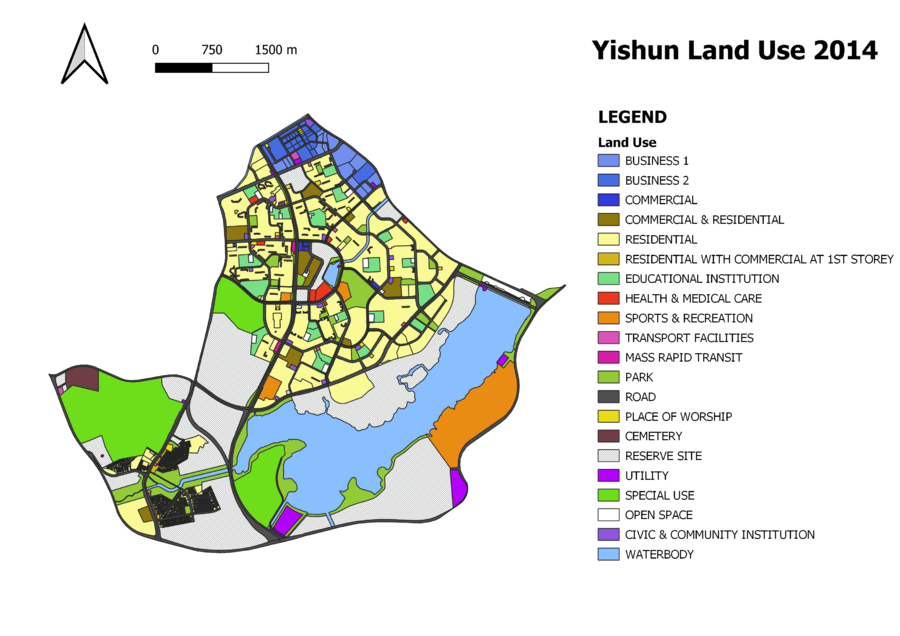
Yishun 2008 & 2014 Land Use
Besides the land reduction leading to Yishun's differing boundary, the land use in the planning area has also changed. Here, we will highlight the major changes observed.
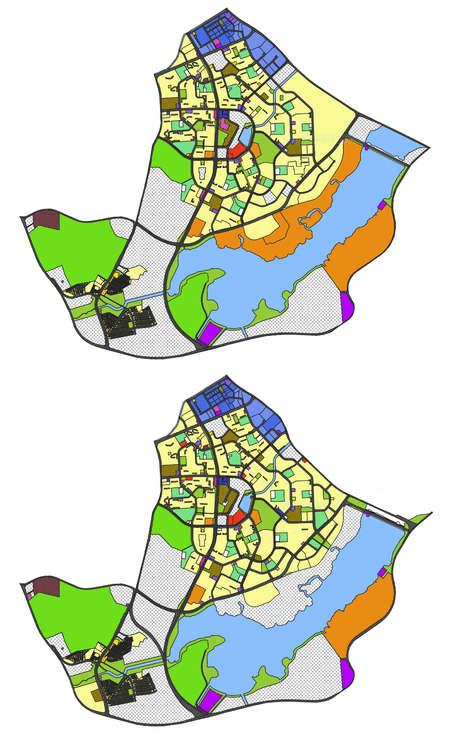
- The area to the left of Lower Seletar Reservoir (Yishun's prominent waterbody) has became a reserve site from previous use for sports & recreation
- Southwest of Yishun, there is a road extension that joins two existing roads
- Further down the aforementioned road, a portion of land that used to be reserved is now accommodating for commercial and residential usage
GIF Animation Depicting Land Use Changes
Population Proportion of Targeted Age Groups
Demographic Segmentation
We have divided the population into 3 categories:
- Young (0 - 24 years old)
- Economic Active (25 - 64 years old)
- Aged (65 and above)
Population Change for the Segments
We have obtained the census/household data from SingStat to analyse the population change between 2008 and 2014 for each target segment identified above. Due to unavailability of the desired information (2008 and 2014), we have used the Basic Demographic Characteristics data for year 2010 and 2015 respectively, which closely follows the timeframe in study.
From the downloaded Excel sheets, we have extracted information relevant to our analysis (i.e. Yishun's population) and cleaned up the data necessarily before saving into separate CSV files ready to be used in QGIS as attribute tables. For instance, the 2010 does not include Nee Soon as part of the subzones of Yishun's population data while the 2015 does. Upon further scrutiny, we realised it was SingStat's decision to omit planning areas/subzones with small number of persons, and that Nee Soon did exist at the year of 2010. Hence, we added in Nee Soon in our 2010 CSV file but with 0's imputed for the population.
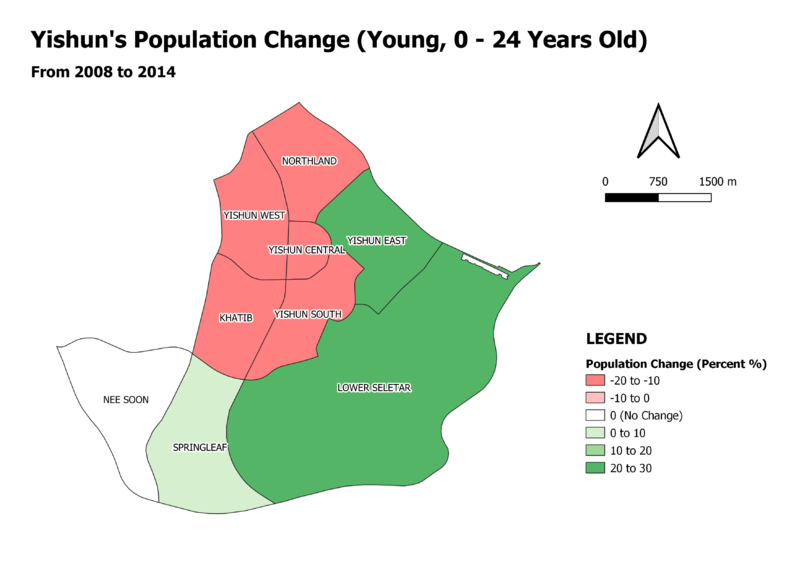
Population Change (Young)
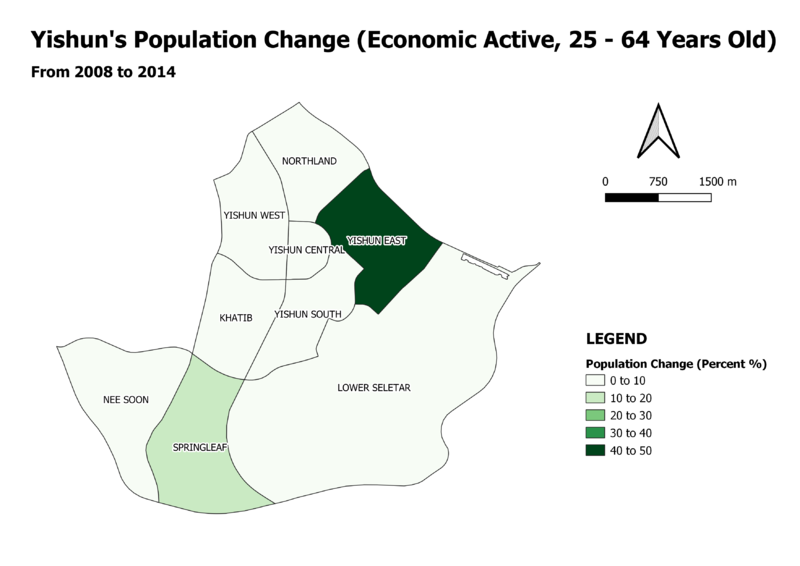
Population Change (Economic Active)
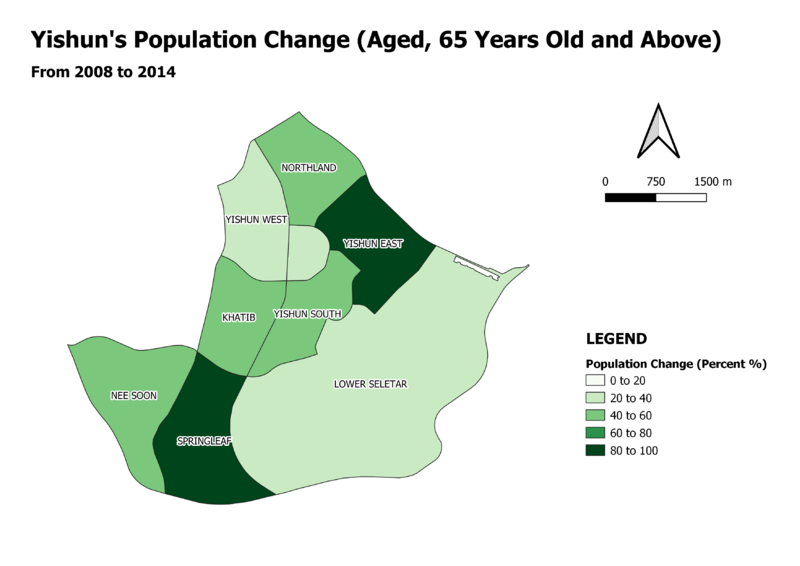
Population Change (Aged)
Land Suitability Modelling
Conclusion & Analysis
the ideal elderly service ..
[[File:|800px|left]]

