File list
Jump to navigation
Jump to search
This special page shows all uploaded files.
| Date | Name | Thumbnail | Size | Description | Versions |
|---|---|---|---|---|---|
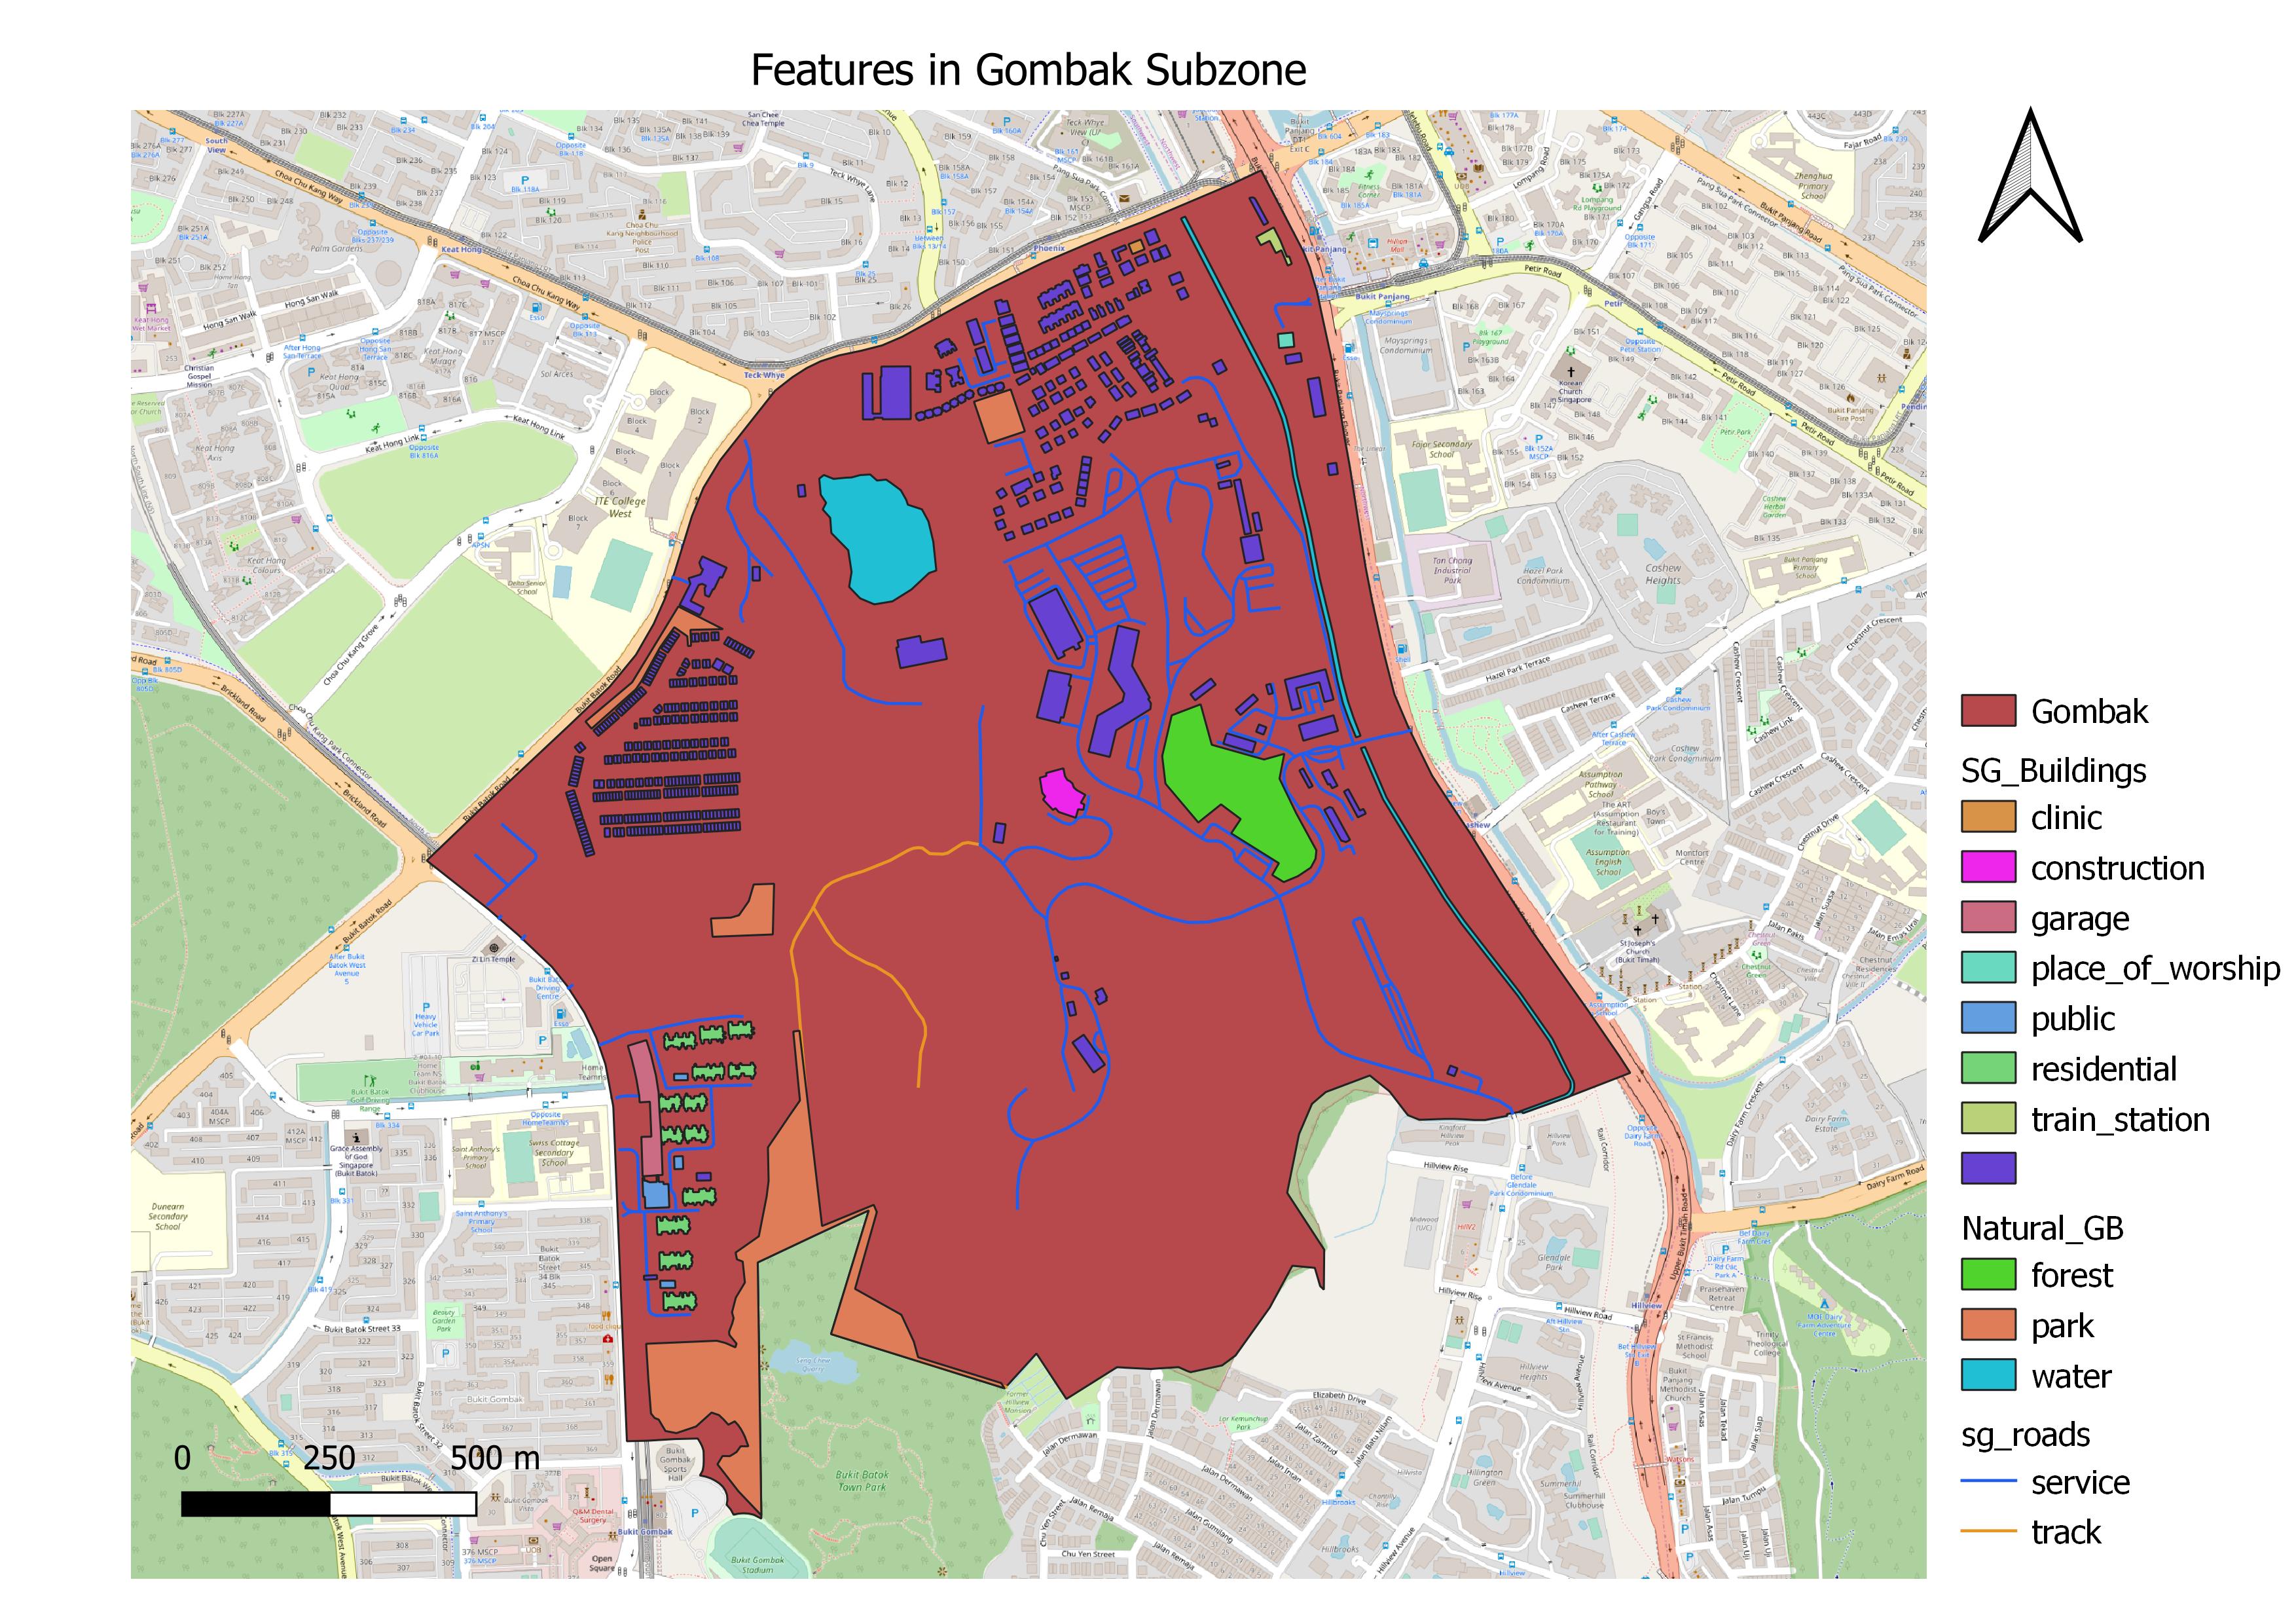
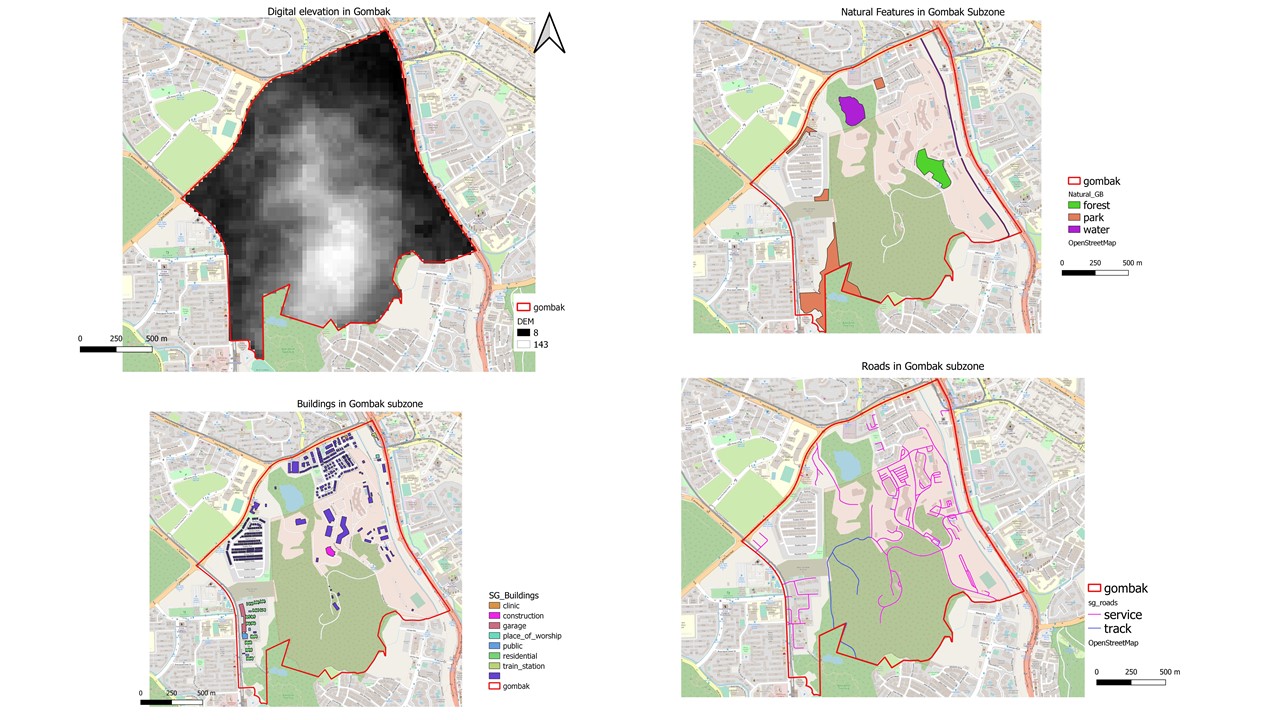
| 14:48, 9 November 2019 | Gombak comb.jpg (file) |  |
948 KB | 1 | |
| 14:40, 9 November 2019 | Suitability Land Lots.jpg (file) |  |
250 KB | 1 | |
| 14:38, 9 November 2019 | AHP ahp.jpg (file) |  |
214 KB | 1 | |
| 14:36, 9 November 2019 | Part3.jpg (file) |  |
139 KB | 1 | |
| 14:32, 9 November 2019 | Part2.jpg (file) |  |
119 KB | 1 | |
| 14:27, 9 November 2019 | Part 1.jpg (file) |  |
212 KB | 1 | |
| 18:21, 16 October 2019 | Home header.jpg (file) |  |
59 KB | 1 | |
| 18:06, 16 October 2019 | Final report header.jpg (file) | 58 KB | 1 | ||
| 17:52, 16 October 2019 | Poster header.jpg (file) |  |
82 KB | 1 | |
| 17:50, 16 October 2019 | Header 3.jpg (file) | 75 KB | 1 | ||
| 17:36, 16 October 2019 | Cck header 2.jpg (file) | 47 KB | 1 | ||
| 17:18, 16 October 2019 | CCK header.jpg (file) |  |
45 KB | 1 | |
| 21:19, 15 October 2019 | CCK.jpg (file) |  |
39 KB | 1 | |
| 17:32, 15 September 2019 | 2018 age.jpg (file) |  |
92 KB | 1 | |
| 17:26, 15 September 2019 | 2018 proportion.jpg (file) |  |
97 KB | 1 | |
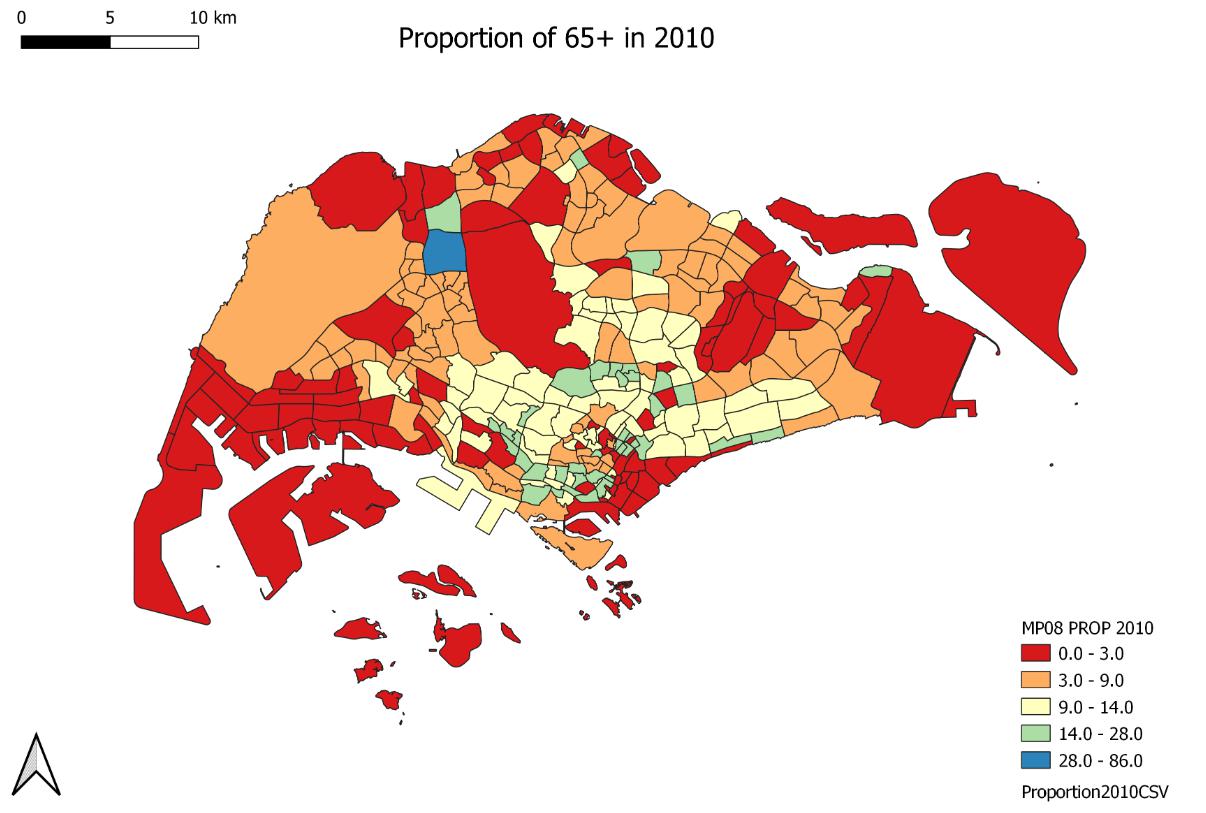
| 17:25, 15 September 2019 | 2010 proportion.jpg (file) |  |
98 KB | 1 | |
| 17:21, 15 September 2019 | 2010 age.jpg (file) |  |
94 KB | 1 | |
| 17:17, 15 September 2019 | Percentage chng.png (file) |  |
895 KB | 1 | |
| 17:06, 15 September 2019 | Education.png (file) |  |
1.73 MB | 2 | |
| 16:59, 15 September 2019 | Road.png (file) |  |
1.92 MB | The different types of roads are represented by different lines of varying widths and colour. | 1 |
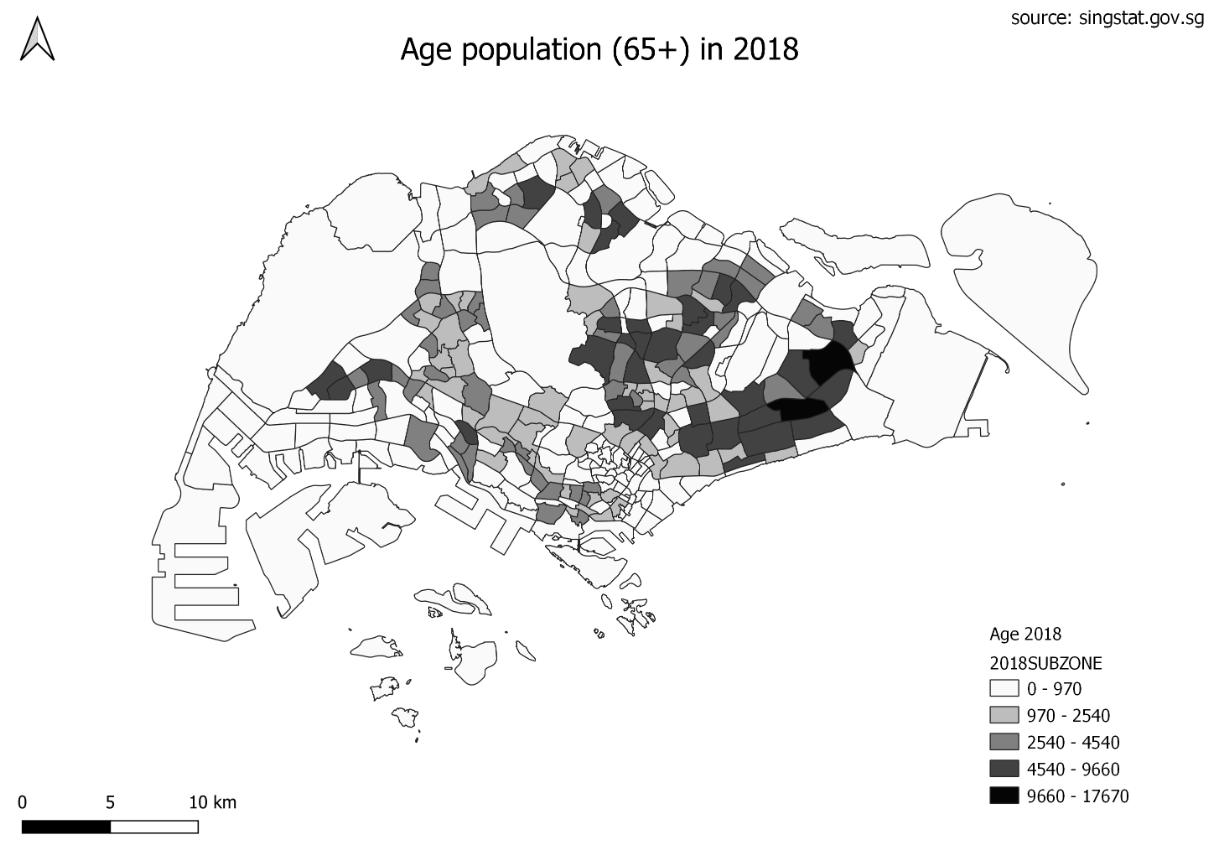
| 16:37, 15 September 2019 | Population 2018.png (file) |  |
707 KB | This map shows the distribution of the population aged 65 years old and above in 2018. The varying intensity of colours indicate the number of people aged 65+ in each planning subzone. Darker intensity highlights that the planning subzone has a higher... | 1 |
| 16:32, 15 September 2019 | Population 2010.png (file) |  |
735 KB | This map shows the distribution of the population aged 65 years old and above in 2010. The varying intensity of colours indicate the number of people aged 65+ in each planning subzone. Darker intensity highlights that the planning area has a higher num... | 1 |
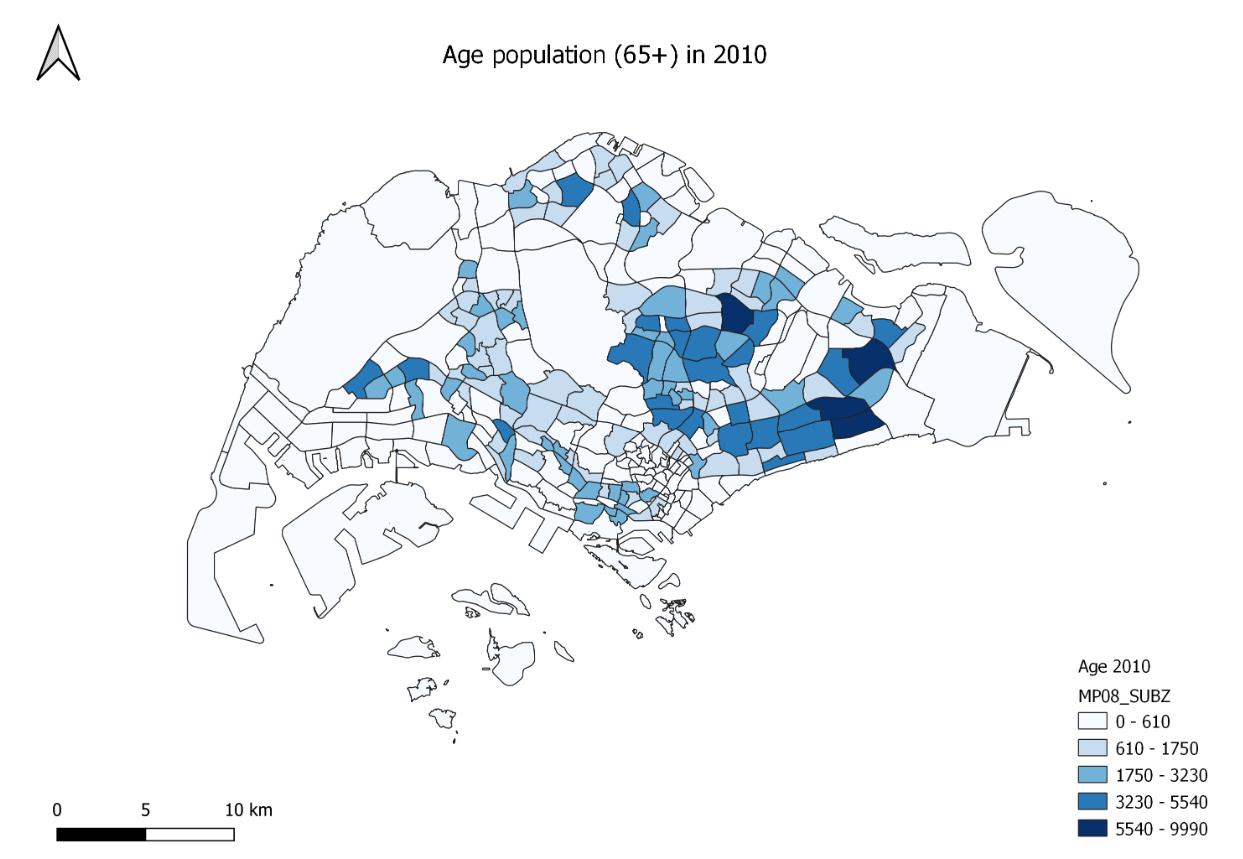
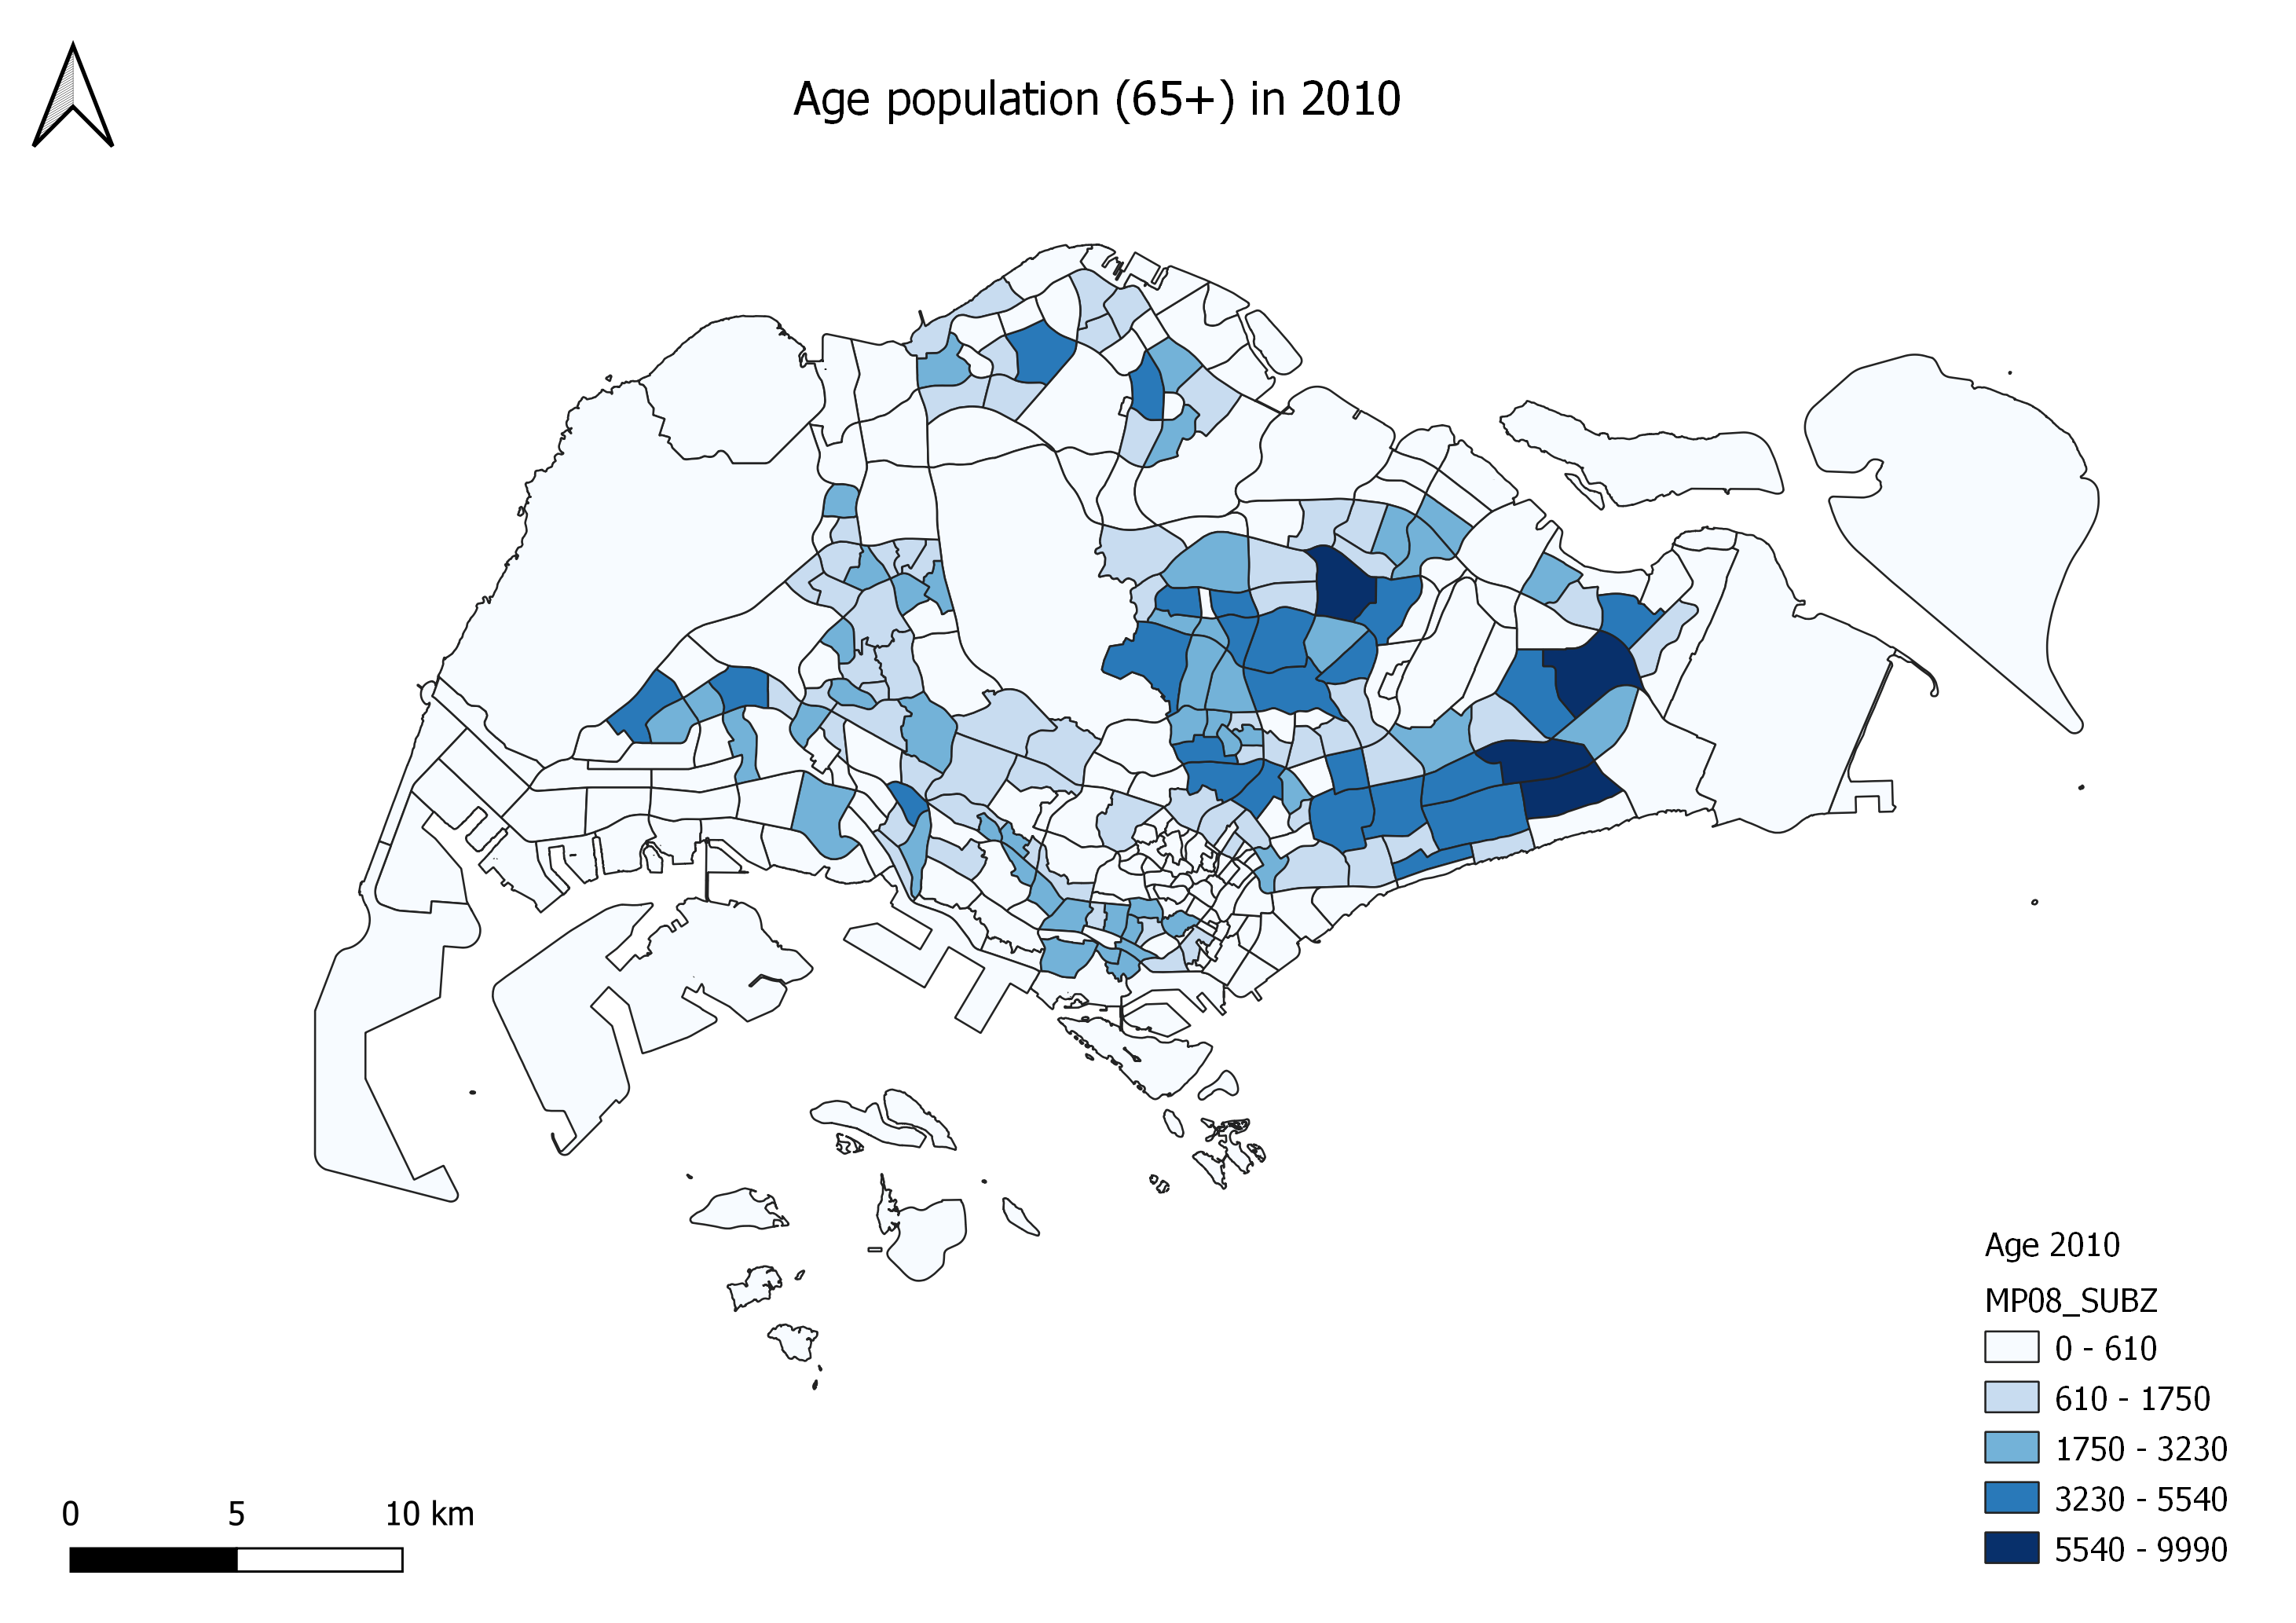
| 16:29, 15 September 2019 | Age 2010.png (file) |  |
735 KB | This map shows the distribution of the population aged 65 years old and above in 2010. The varying intensity of colours indicate the number of people aged 65+ in each planning subzone. Darker intensity highlights that the planning area has a higher num... | 1 |
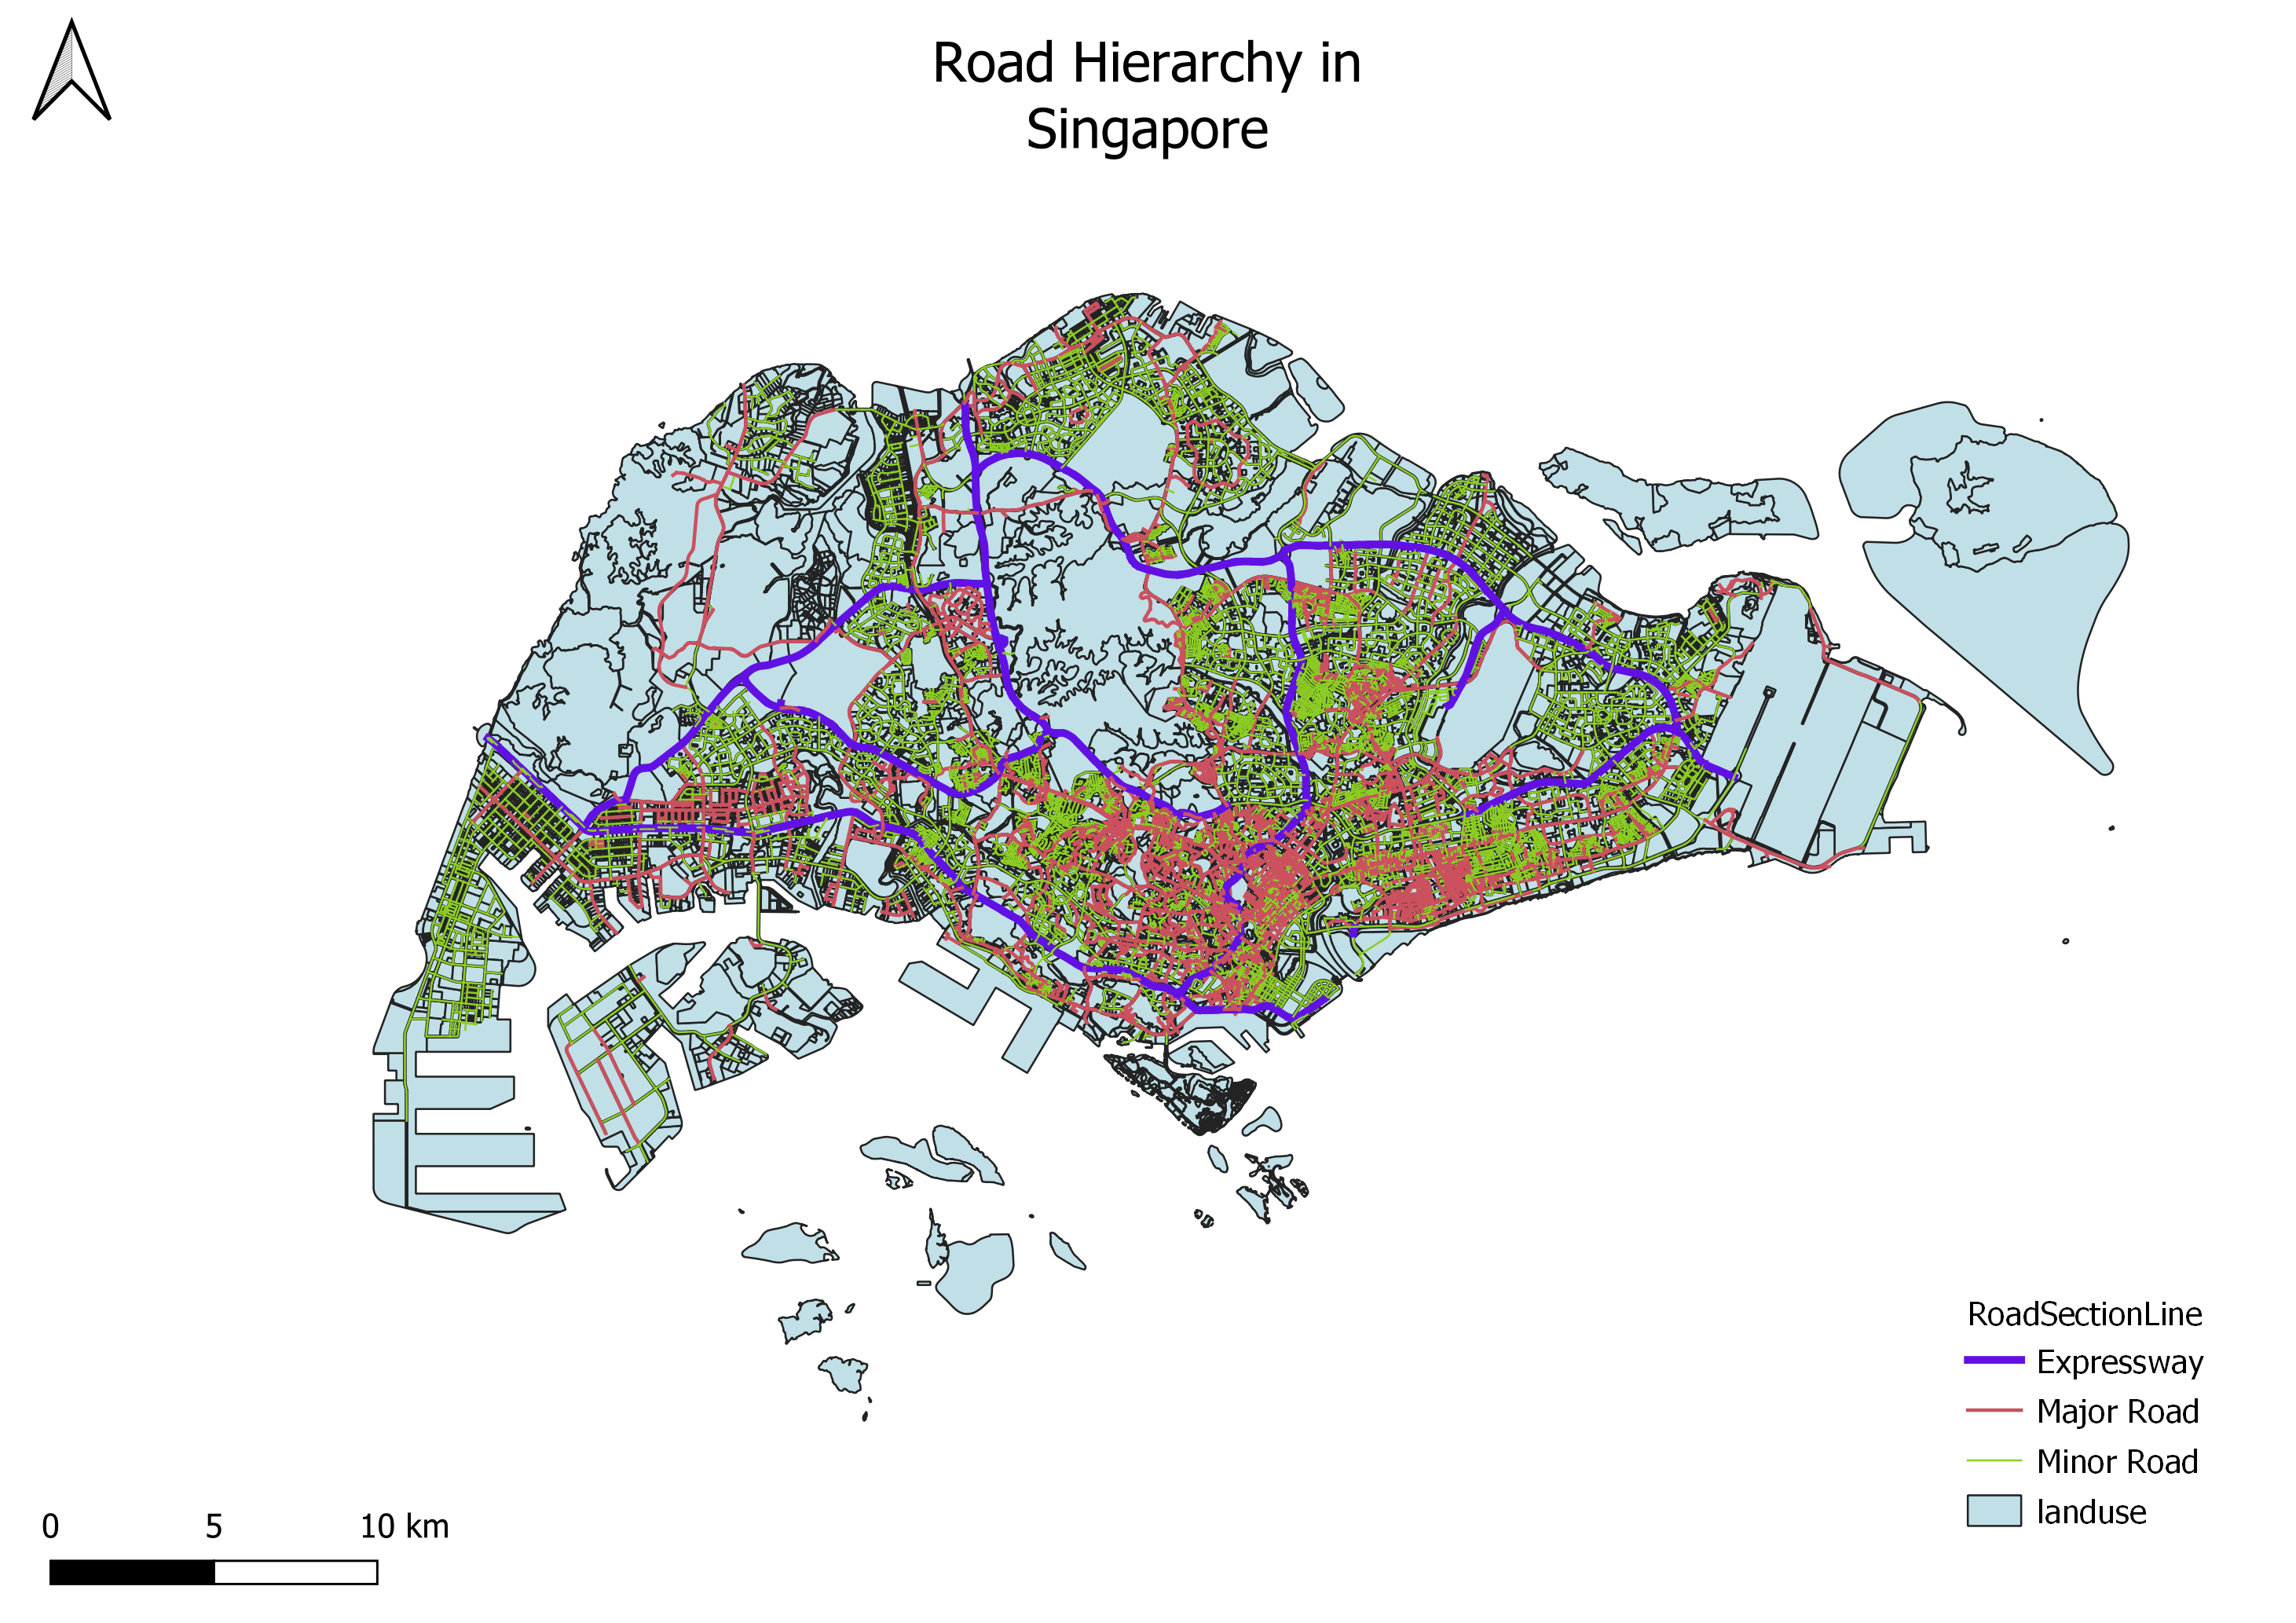
| 16:14, 15 September 2019 | Road hierarchy.png (file) |  |
1.92 MB | The different lines of varying widths and colours represent the different types of roads in Singapore, namely the expressways, major roads and minor roads. | 1 |
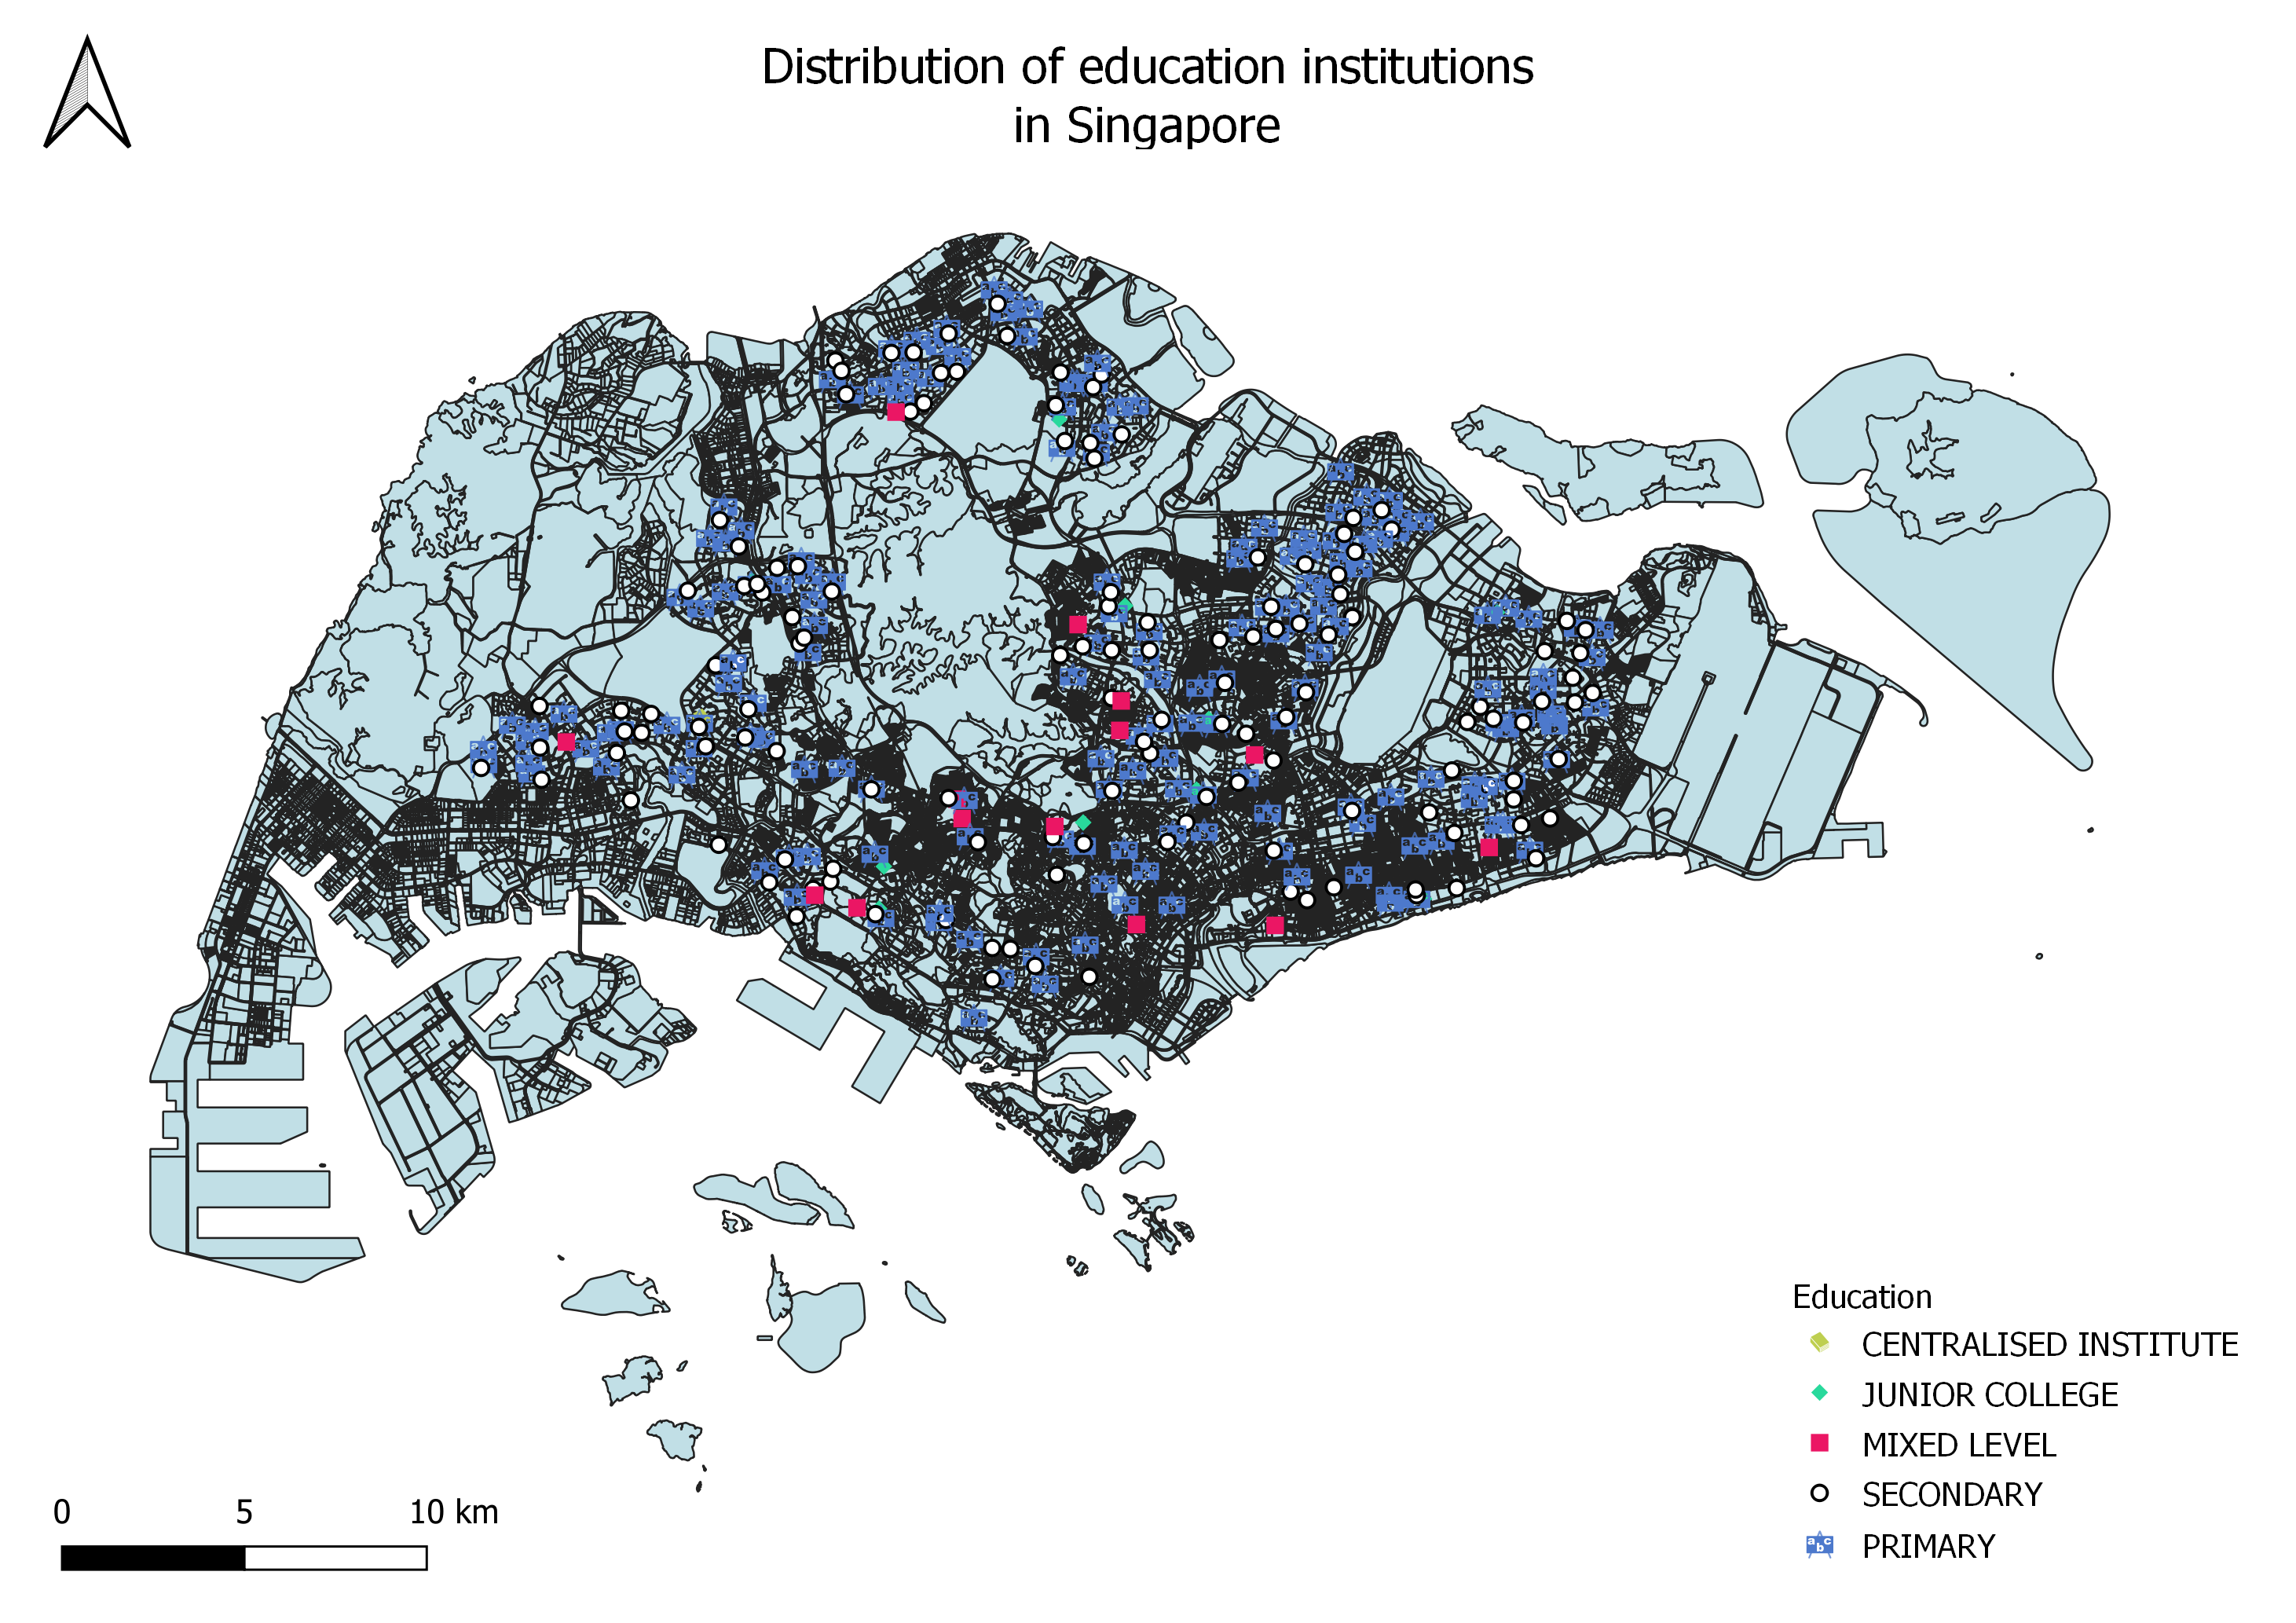
| 16:07, 15 September 2019 | Education.jpg (file) |  |
1.73 MB | The Education layer and the MP14 Landuse layer can be seen in this image. The different SVG markers represent the different types of educational institutes in Singapore. | 1 |