SMT201 AY2019-20T1 EX2 Kong Yi Ru Kaelyn
Contents
Background of Study Area
Gombak Planning Subzone, or Bukit Gombak, is located in Bukit Batok Planning Area, in the central-west part of Singapore. In order to identify the most suitable location for building a national Communicable Disease Quarantine Centre, we will be studying both natural and man-made features present and weighing each feature’s importance in deciding where is most suitable.
Initial Analysis of Study Area
We will be analyzing four features, the buildings, roads, natural features, and elevation of the subzone. Each of these features contribute as a decision factor in the following ways.
| Decision Factor | Feature Analysed |
|---|---|
| 1. Health Risk Factor | Buildings |
| 2. Accessibility Factor | Roads |
| 3. Natural Conservation Factor | Natural Features |
| 4. Economic Factor | Slope |
[[File:Takehome2.png|1000px|frameless|center]
1. Health Risk Factor (Buildings)
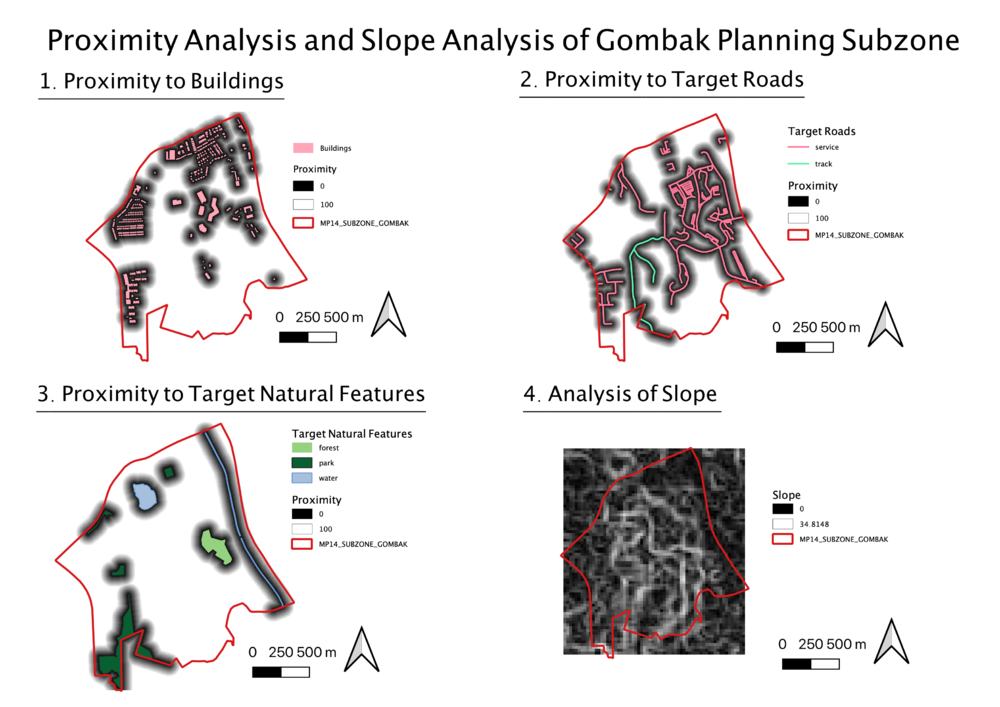
Due to the nature of a Disease Quarantine Centre, it is important that the selected site should be away from residential and working areas, i.e. located away from buildings. In the Buildings data from OpenStreetMap, it was null for most of the values in attribute ‘Type’. Therefore, I clipped the 2014 Masterplan Landuse layer with the buildings layer, to get a better idea of the type of buildings. This shows that the buildings in Gombak Planning Subzone consist of mostly special use and residential buildings. Therefore, the selected site should be situated far away from any of these buildings.
2. Accessibility Factor (Roads)
In order for ease of construction and transportation of goods, the selected site should be near service roads and tracks. The Roads layer from OpenStreetMap also contained information on other types of roads, such as residential roads or footways. Therefore, service roads and tracks were selected, and categorized as shown, using different colours to represent the different roads.
3. Natural Conservation Factor (Natural Features)
The selected site should be away from natural features, namely forests, parks and water. Several of these natural features can be found in Gombak Planning Subzone, as shown, where several parks, forests and water features are found. They are categorized into those respective categories, and represented by using colours representing the nature of the feature, for easy differentiation between features. Dark green is used to represent parks, light green for forests, and light blue for water features.
4. Economic Factor (Slope)
The selected site should avoid steep slope due to the high cost of construction on such areas. To study the slope in Gombak Planning Subzone, ASTER GDEM raster data was imported, clipped, and categorized as shown. A graduated model is used, to show the range of elevation above sea level in the subzone. The elevation ranges from 8 to 145 metres above sea level. The greatest elevation in the subzone is situated near the centre to southern area of the Subzone, and the areas near the subzone boundary have lower elevations.
Proximity and Slope Analysis
To study the proximity to the different features, the different vector layers were rasterized before carrying out proximity analysis. This was done by first creating a new column, POI code, then converting it using to a raster layer, using georeferenced units as the output raster size units. For ease of comparison, the largest distance studied was from 0 – 100 metres for the 3 target features. The proximity to the features is represented as shown, where the darker the areas, the closer they are to the target features.
1. Proximity to Buildings
The furthest distance from the buildings is 100m, represented by the black areas. Although a large portion of the subzone contains residential buildings, many of them are located at the northern part of the subzone, and only a few are located at the southern part.
2. Proximity to Target Roads
The furthest distance from service roads and tracks is 100m, represented by the black areas. Gombak Planning Subzone contains an extensive network of service roads and tracks that extend throughout the entire subzone. Most plots of land are situated in close proximity to at least one of the target roads.
3. Proximity to Target Natural Features
The furthest distance from the forests, parks and water is 100m, represented by the black areas. Only 7 target natural features are located in this subzone. A moderate part of the land area is not situated near these features, except along the boundary.
4.Analysis of Slope
The legend shows that the minimum and maximum values of the slope values are 0 and 34.8148 degrees, represented by the colours black and white respectively. Dark grey areas on the map are indicative of a gentle slope, while light grey areas are indicative of a steeper slope.
Criterion Score
To come up with the criterion score for the different features, the SAGA raster standardization feature was used to standardize the values of the features to a range of 0 to 1. This allows the different features to be compared on the same scale, such as distance measures (metres) and slope (degrees) can be fairly compared against each other. The same colour ramp was also used for easier comparison.
1. Criterion Score for Buildings
The selected land should be situated far away from buildings, as displayed by the areas in dark blue. The scores range from 0 to 1, with 0 indicating close proximity to buildings, represented by the white areas, while 1 indicates that the area is further away from the buildings, represented by a dark blue colour. The darker the colour, the greater the distance from the buildings. The chosen area should preferably be situated in a dark blue area. Majority of the area is white or light blue in colour, showing that there are many buildings spread throughout the subzone.
2. Criterion Score for Target Roads
For ease of transportation of construction materials, the selected land should be near service roads and tracks. The scores range from 0 to 1, with 0 indicating close proximity to the target roads, represented by the dark blue areas, and 1 indicating that the area is further away from the target roads, represented by the white areas. The darker the shade of blue, the closer it is to the target roads. The chosen area should preferably be situated in a dark blue area. Much of the area in the subzone are medium to dark blue in colour, showing that the Gombak Planning Subzone has an extensive network of target roads.
3. Criterion Score for Target Natural Features
The selected land should be situated far away from the target natural features, i.e. forests, parks and water features, as displayed by the areas in dark blue. The scores range from 0 to 1, with 0 indicating close proximity to natural features, represented by the white areas, while 1 indicates that the area is further away from the natural features, represented by a dark blue colour. The darker the colour, the greater the distance from the target natural features. The chosen area should preferably be situated in a dark blue area. With the natural features being relatively spread out across the subzone, majority of the area is white or light blue in colour, showing that many areas are near natural features.
4. Criterion Score for Slope Analysis
The selected land should not be on a steep slope, due to increased cost of construction. The scores range from 0 to 1, with 0 indicating a gentle slope, and 1 indicating a steep slope. The darker the colour, the greater the slope. The chosen area should preferably be situated in a dark blue area. Many areas shown are white or light blue, showing that it is a relatively hilly area.
AHP Analysis
The Analytical Hierarchical Process (AHP) helps us to make fair decisions when deciding amongst multiple factors. The pair-wise comparison matrix is used to calculate the relative costs between the different factors.
Reasons for Ranking of Decision Factors
I believe that the Health Risk Factor is the most important factor. Prior analysis of the study area has shown that there are many residential buildings in the area, and has many people staying in the subzone. Preventing disease from spreading to the nearby population should be the top priority, as there is a high chance that a large number of people might be infected, and might eventually lead to an epidemic.
The second most important factor is the Economic Factor, to avoid steep slope. A steep slope would cause the government to incur much higher costs to construct the quarantine centre, as a lot of cut-and-fill would be required to level the land. Research has also shown that it could even cost multiple times the original cost, and hence, makes it an important consideration.
Thirdly, Accessibility is important, in order for ease of transportation of construction materials to the site of construction. Without having such accessibility, it would be costly and inconvenient to transport the materials, as no local roads are available.
Lastly, the Natural Conservation Factor is the least important of the four, as there are very few natural features in Gombak Planning Subzone, and those features are unlikely to be heavily affected by being close to the selected site.
Computation of AHP Scores
Using the AHP Template provided by SCB Associates, I computed the weights of each decision factor as shown.
| Relative Importance (Decreasing) | Decision Factor | Weight |
|---|---|---|
| 1 | Health Risk Factor | 0.552 |
| 2 | Economic Factor | 0.255 |
| 3 | Accessibility Factor | 0.128 |
| 4 | Natural Conservation Factor | 0.065 |
As the consistency was 8%, which is below 10%, this AHP matrix can be used.
Using the weights of each factor, the final land suitability layer was computed using the raster calculator with the following formula, such that the relative importance of each factor was taken into consideration to give the final suitability of the land.
Formula Used:
0.255*"Standardised Slope@1" + 0.128*"Standardised Roads@1" + 0.552*"Standardised Buildings@1" + 0.065*"Standardised Natural@1"
Land Suitability Analysis
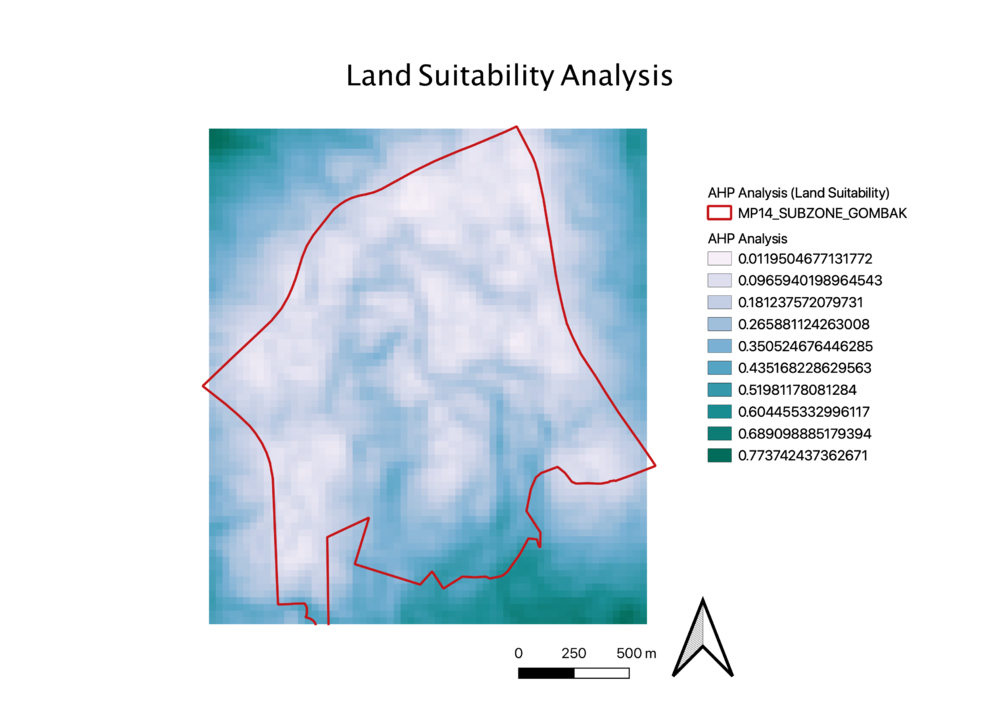
The map shown is the output after considering the weights of each factor, with the score of land suitability given in the legend.
I then reclassified the AHP Analysis layer using ‘Reclassify by Table’ to give a map showing the suitability on a scale of 1 – 10.
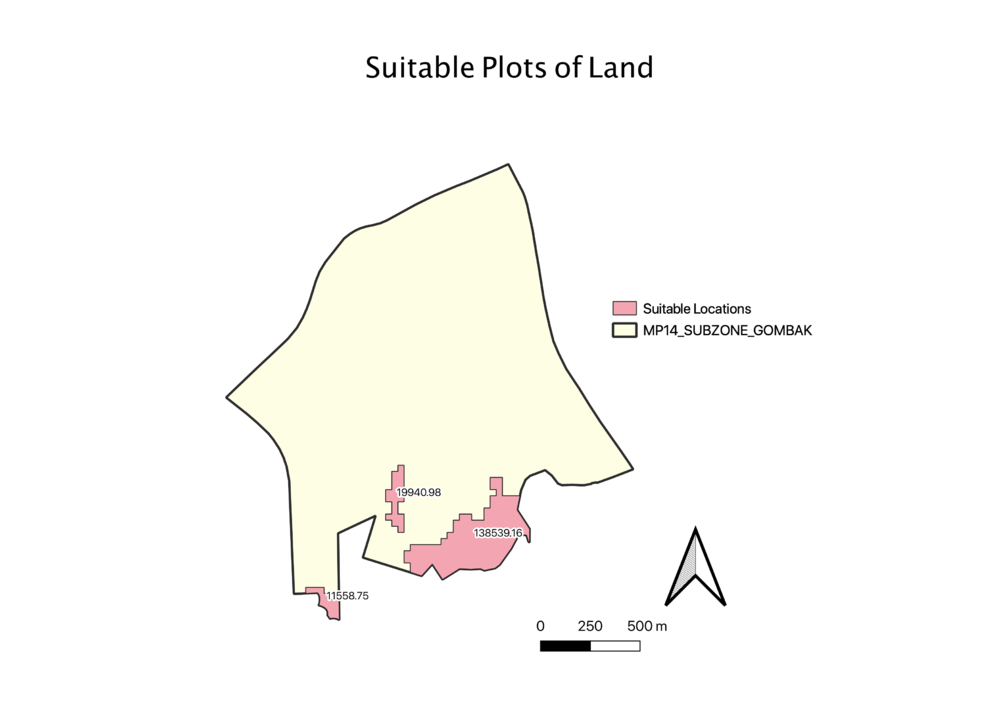
From this, I defined ‘Suitable Locations’ as plots of land with suitability > 5, converted the layer into a vector layer, and selected the plots of land that have an area of at least 10,000m2. The following plots of land were identified as possible areas to build the quarantine centre.
Recommendations
Therefore, amongst the suitable locations, the plot of land highlighted was chosen as the most suitable location. It has the largest land area of the three locations, with a contiguous land area of 138539.16m2, and is also situated the furthest away from buildings and natural features. The other 2 plots of land have much smaller land areas, and have a narrow shape.
However, as the chosen plot of land also lies along the boundary of the subzone, we could not take into consideration if the land of the neighbouring subzone across the border, contains any of the target features, such as roads, natural features or buildings, and is one limitation of the analysis. We are only studying this subzone in isolation, but in reality, we should also consider surrounding areas nearby.
Data
| Dataset | Source |
|---|---|
| Subzone Data | https://data.gov.sg/dataset/master-plan-2014-subzone-boundary-no-sea |
| Master Plan 2014 Land Use Data | https://data.gov.sg/dataset/master-plan-2014-land-use |
| Buildings, Road, Natural Features | https://www.bbbike.org/Singapore/ |
| ASTER Global Digital Elevation Model (GDEM) dataset | https://search.earthdata.nasa.gov/search?m=-7.175!25.59375!1!1!0!0%2C2 |
| Analytical Hierarchical Process Template | http://www.scbuk.com/AHP%20Template%20SCBUK.xls |


