SMT201 AY2019-20T1 EX2 DionTeoMengEn
To build a National Communicable Disease Quarantine Centre, we need to identify a suitable plot of land that is of at least 10,000m2, the following decision factors are to be considered:
- Economic factor: The selected site should avoid steep slope. This is because construction at steep slope tends to involve a lot of cut-and-fill and will lend to relatively higher development cost.
- Accessibility factor: The selected site should be close to existing local roads, namely: service roads and tracks. This is to ensure easy transportation of building materials during the construction stage.
- Health risk factor: The selected site should be away from population i.e. housing areas and offices in order to avoid disease spreading to the nearby population.
- Natural conservation factor: The selected site should be away from forested land, park and water.
The following analysis will include discussions relating to:
- The respective target features (i.e. Roads, Buildings, Natural features, Elevation) present in the study area
- Proximity analysis of these target features
- Criterion Scores for each decision factor
- An Analytical Hierarchical Process input Matrix and the relevant results
Combining all above discussions, a suitable land lot for the construction of the National Communicable Disease Quarantine Centre will then be suggested.
Contents
Target Features
Roads
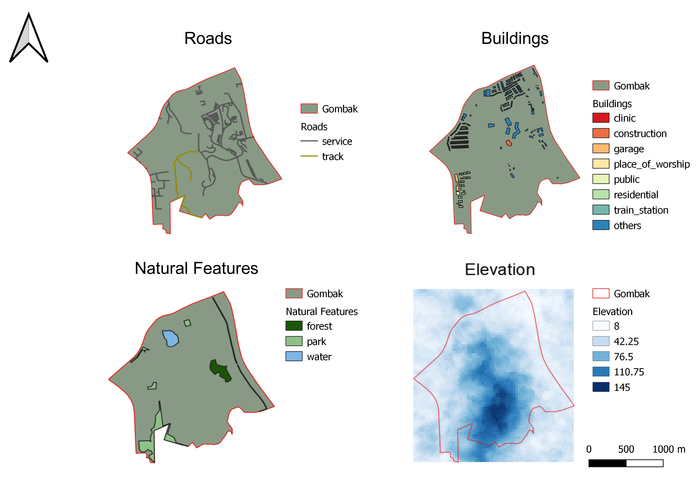
The target feature, Roads, reflects the level of accessibility in deciding the appropriate site for constructing the National Communicable Disease Quarantine Centre. The selected site should be close to existing roads so as to facilitate transportation of the necessary materials needed for construction. Particularly for this exercise, we are looking mainly at just roads for service and track, as we foresee that these are the roads that we predominantly need for the transportation of the building materials during the construction stage.
As shown in the above map, the 2 different types of road are classified and distinguished from the different colors used. There are a total of 199 service and 2 track roads serving the planning subzone of Gombak. These roads are rather well distributed across the study area of Gombak.
Buildings
The target feature, Buildings, reflects the level of Health Risks posed to the residents in the study area, Gombak. As quarantine center for communicable diseases, the selected site should, ideally, avoid and be far from buildings that house most of the population (i.e. housing or residential areas as well as offices). This is to prevent and lower the risks of such diseases spreading to the nearby population.
As shown in the above map, the different buildings that caters to the different needs of the population are classified and distinguished from the different colors used. These buildings are generally concentrated up North of the study area, Gombak, with the residential buildings focused in the general South-West of Gombak.
Natural Features
The target feature, Natural Features, reflects the factor of natural conservation when it comes to deciding and selecting a probable site for the construction of the National Communicable Diseases Quarantine Center. The selected site should, ideally, be away from forested land, parks and the water, such that we can conserve these areas and not have to demolish these areas to give way to the Center.
As shown in the above map, the different nature features are classified and distinguished from the different colors used. The colors were also selected such that users can intuitively recognize these areas (i.e. deep green for forests, plain green for parks and blue for water). These different features span across the study area, Gombak.
Elevation
The elevation of the land affects the economic factor when it comes to deciding a site for the construction of the National Communicable Diseases Quarantine Centre. Ideally, the selected site should avoid steep slopes to facilitate the construction process. A steep area will require a lot of cut-and-fill and result in higher development costs.
As shown in the above map, the different intensity of blue suggests the steepness (i.e. elevation) of the given area. The higher the intensity of blue, the higher the land is above sea level. With reference to the map, the elevation ranges from 8 to 145m above sea level, with the area of higher elevation lending towards the South of the study area.
Proximity Analysis
In this section, proximity analysis is conducted to find out the distance of the areas in the study area, Gombak, from the target features. This was done to assess the suitability of the potential areas where we can construct the National Communicable Diseases Quarantine Center.
Proximity to Roads
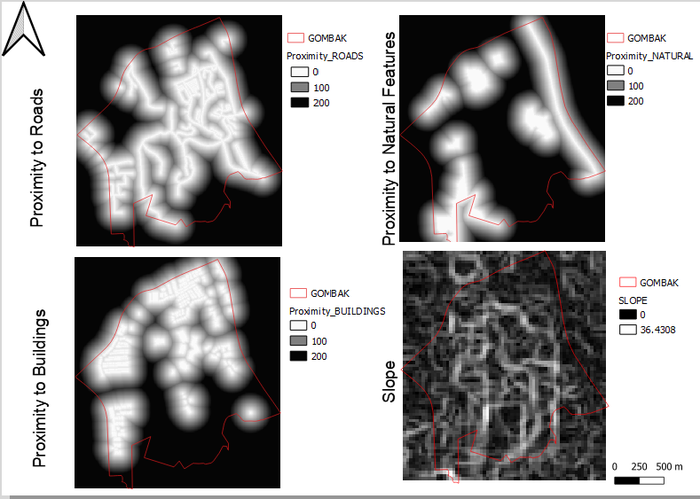
As with the other maps, the higher the intensity of the color reflects areas which are further away from the roads (i.e. service and track roads). In this case, the black areas are areas that are at least 200m, and the grey areas depict areas that are between 100m to 200m away from roads. Lastly, the whites are areas that are near the roads, being less than 100m away from them.
Proximity to Natural Features
As with the other maps, the higher the intensity of the color reflects areas which are further away from the natural features (i.e. forested land, parks and water). In this case, the black areas are areas that are at least 200m, and the grey areas depict areas that are between 100m to 200m away from the natural features. Lastly, the whites are areas that are near the natural features, being less than 100m away from them.
Proximity to Buildings
As with the other maps, the higher the intensity of the color reflects areas which are further away from the buildings. In this case, the black areas are areas that are at least 200m, and the grey areas depict areas that are between 100m to 200m away from the buildings. Lastly, the whites are areas that are near the buildings, being less than 100m away from them.
Slope
As for slope, the degree of elevation ranges from 0 to 36.4308 degree. With reference to the legend for this particular map, the higher the intensity of the color reflects areas with gentler slope. In essence, the darker the color, the less steep (i.e. flatter) the land.
Criterion Scores
To make all of the decision factors comparable, there is a need to normalize the results of each factors derived from the proximity analysis (see above). Below shows the formula for normalization:
Normalized Result = (Proximity Result – Min Proximity) / (Maximum Proximity – Minimum Proximity)
After normalization, the scores range from 0 to 1, with 0 being the least suitable and 1 being the most suitable area to construct the National Communicable Diseases Quarantine Center.
Accessibility
For accessibility, the normalized result has been inverted. Reason being, the higher the result for proximity to roads, the lower the suitability the area is, since it is further away from the roads. Hence, the normalized result for Roads is inverted in order for us to get an accurate sensing of the suitability. From the map, the areas that leans towards the color red are areas which are more suitable, and conversely, areas that leans towards the color blue are areas which are less suitable.
Natural Conservation
For natural conversation, the higher the result for proximity to natural features, the higher the suitability the area is, since it is further away from the natural features. Hence, the normalized result for proximity to natural features will help us to get an accurate sensing of the suitability. From the map, the areas that leans towards the color red are areas which are more suitable, and conversely, areas that leans towards the color blue are areas which are less suitable.
Health Risk
For health risk, the higher the result for proximity to buildings, the higher the suitability the area is, since it is further away from the buildings. Hence, the normalized result for proximity to buildings will help us to get an accurate sensing of the suitability. From the map, the areas that leans towards the color red are areas which are more suitable, and conversely, areas that leans towards the color blue are areas which are less suitable.
Economic
Similarly, for economic factor, the normalized result has been inverted. Reason being, the higher the result for Slope suggest a lower the suitability the area is, since it is steeper. Hence, the normalized result for Slope is inverted in order for us to get an accurate sensing of the suitability. From the map, the areas that leans towards the color red are areas which are more suitable, and conversely, areas that leans towards the color blue are areas which are less suitable.
Analytical Hierarchical Process
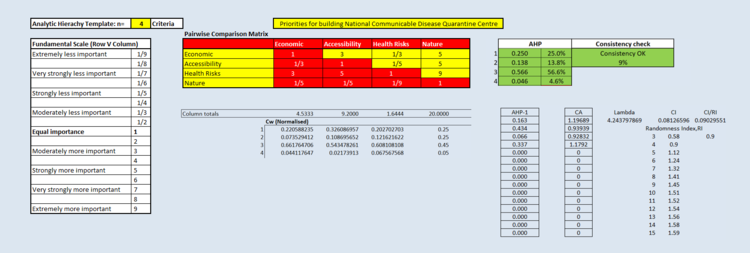
The Analytical Hierarchical Process tabulates and generates the relative weightage of each decision factor to another. A higher AHP score reflects the greater relative importance of a decision factor when compared to the other factors.
In this analysis, it was apparent that Health Risk was the most important deciding factors. Reason being, as with all other infectious or contagious diseases, containing the disease is the top priority and that means that the need to reduce the widespread of such diseases is paramount. That being said, Health risk was then given a higher score when compared to all the other factors. Similar logic follows for the rest of the factors. The tabulation then generates the different weightage for the factors as follows:
- Economic: 0.250
- Accessibility: 0.138
- Health Risks: 0.556
- Nature: 0.046
This results is also at 9% consistent with our analysis.
Identifying Suitable Land Lot(s)
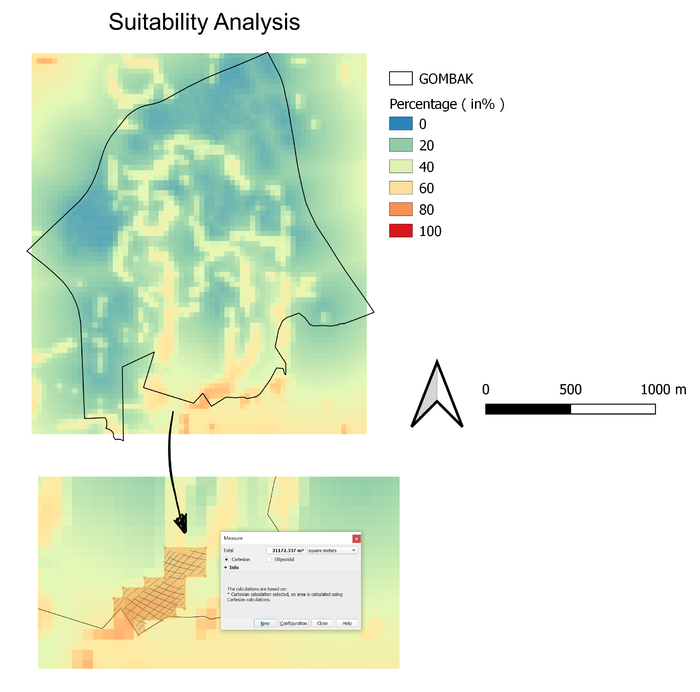
The above land lot down South of the study area, Gombak, has been identified as a suitable area for the construction of National Communicable Diseases Quarantine Center. The identified land lot fulfills all the above criteria and decision factor, Accessibility, Natural Conservation, Health Risks as well as Elevation. The identified land lot also fulfills the minimum a contiguous area of at least 10,000m2.


