SMT201 AY2019-20T1 EX2 Christal Poon
Contents
Take-home Exercise Report
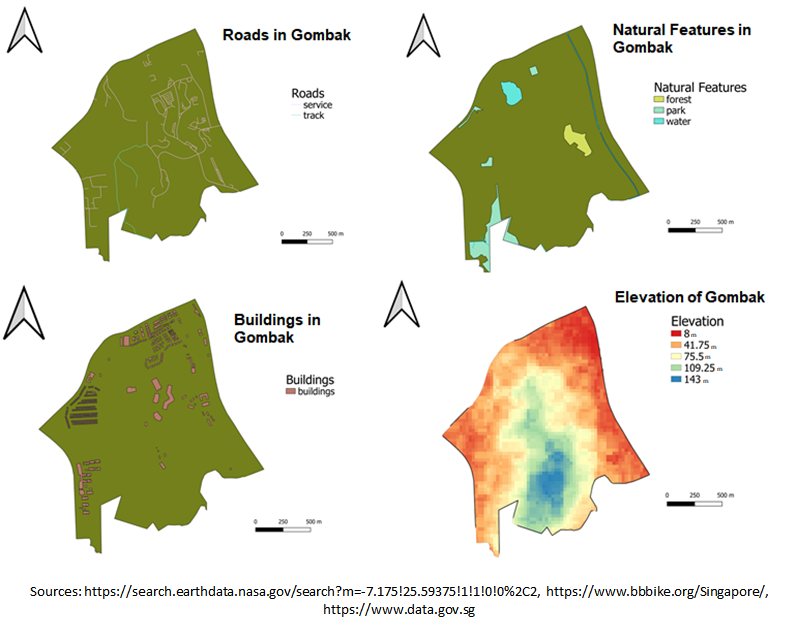
Gombak Map Layouts
The task of building a national Communicable Disease Quarantine Centre within the Gombak planning suzobzone requires planners to take into consideration 4 factors: Economic, Accessibility, Health risk, and Natural conservation.
Accessibility Factor (Roads):
The roads types that we are focusing on are the service roads and tracks. The site ought to be close to these existing local roads to ensure easy transportation of building materials during the construction stage. We can observe that the roads are sparse and spread out across Gombak. The service roads are concentrated towards the North-East of Gombak while the tracks are found towards the South of Gombak.
Natural Conservation Factor (Natural Features):
There are 4 parks, 3 water bodies, and a forested area found in Gombak. The site should be located away from these areas to ensure that these natural areas would not be compensated in favour of the Communicable Disease Quarantine Centre. As there are limited natural areas in Gombak, there is a large area of land that is unoccupied, especially in central and southern Gombak.
Health Risk Factor (Buildings):
The buildings in Gombak mainly consists of residential bulidings and offices. The data provided does not provide the type of building for every single fid. After cross-checking with Google Maps and Master Plan Use 2014 from data.gov, the majority of the buildings in Gombak are residential and commercial sites. Thus, I have decided to classify all of the buildings in Gombak as risk areas. Buildings are concentrated in Northern, Western, South-western, and Central Gombak whereas it is more sparse in southern and South-Eatern Gombak.
Economic Factor (Elevation / Slope):
The elevation in Gombak is the steepest in the south, where it is 143 meters above sea level. The site should avoid these steeper slopes in Southern Gombak as is expensive to invest in more development costs (i.e. Building on steeper slopes involve more cut-and-fill).
Gombak Map Layouts with Proximities
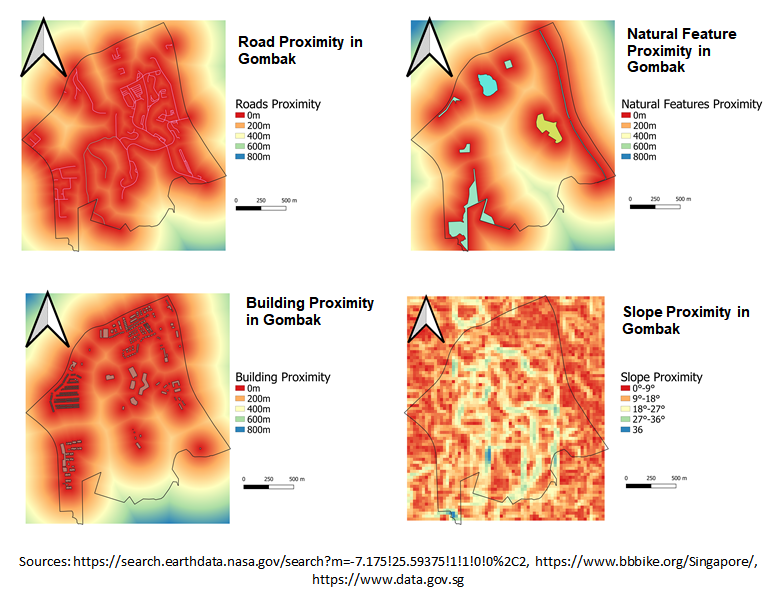
Proximity Maps: Accessibility Factor (Roads), Natural Conservation Factor (Natural Features), and Health Risk Factor (Buildings)
To get the road, natural feature, and building proximity, I rasterised the three layers and analysed the rasters by proximity.
For the Roads layer, it is saturated with warmer tones (red, orange, and yellow), indicating that most of Gombak is less than 600m away from any road.
For the Natural Features layer, South-eastern Gombak has a large area of green, indicating at this area is at least 600m away from any natural feature. The rest of Gombak are mainly within 0m to 400m away from a natural feature.
For the Building layer, only the Southern part of Gombak near the subzone line is of a cool tone (i.e. green indicates 600m away from a building) whereas the rest of Gombak is of a warmer tone, indicating that most of Gombak is less than 600m away from any building.
Proximity Map: Economic Factor (Slope)
To get the slopes in Gombak, it was calculated via slope raster analysis of the elevation layer from ASTER GDEM. From the map, we can observe that the central part of Gombak has cooler tones (i.e. green and blue) indicating that there are steeper slopes found there than compared to areas closer to the borders of the subzone area of Gombak.
Map Layout With Criterion Scores
Using the following formula: 𝑴𝑴(𝒙𝒊𝒋)=𝒙𝒊𝒋−𝒙𝒎𝒊𝒏𝒙𝒎𝒂𝒙−𝒙𝒎𝒊𝒏), I standardised the proximity layers and the slope layer. This causes all of the factors to fall within the range of 0 and 1. This allows for easy comparison among different sets of data with different ranges formerly.
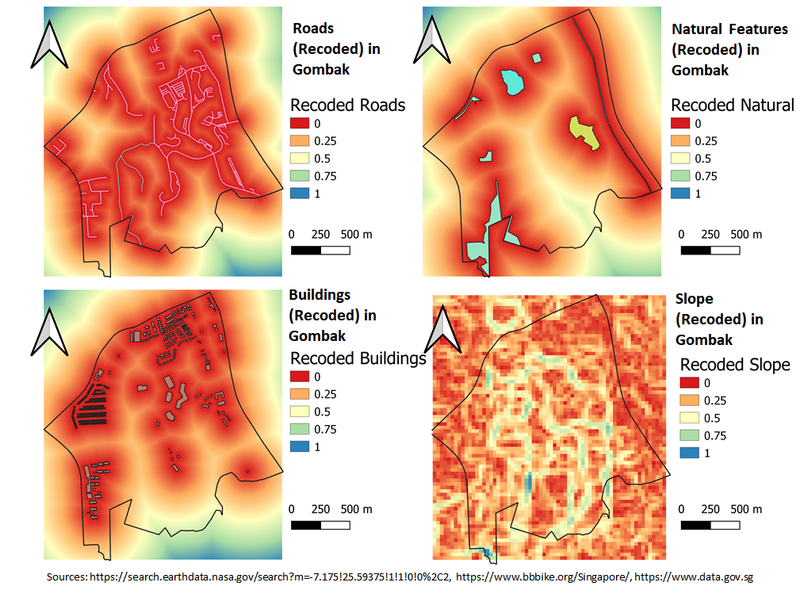
Standardised Proximity Maps: Accessibility Factor (Roads), Natural Conservation Factor (Natural Features), and Health Risk Factor (Buildings)
Red areas (indicating 0) means that these areas are closer to the respective road, building, or natural feature, whereas blue (indicating 1) means that areas are further away to the respective road, building, or natural feature.
Standardised Proximity Map: Economic Factor (Slope)
Red areas (indicating 0) means that these areas are gentler in elevation, whereas blue (indicating 1) means that these areas are steeper in elevation. Therefore, red areas are more desirable to build the site of the Communicable Disease Quarantine Centre.
AHP Matrix And Results
The Analytical Hierarchical Process (AHP) function requires the planner to rank the relevant criterias, and then compare each criteria to each other by deciding which one is more important. I have weighed the following factors in importance in descending order:
1. Health Risk 2. Accessibility 3. Economic 4. Natural Conservation
I strongly believe that Health Risk is the most important factor due to the nature of the site (i.e. a quarantine centre is meant to prevent a person with a disease from being transmitting it onto another). If Health Risk was not prioritised, it was cause many negative externalities in Gombak, and even Singapore. Secondly, I prioritised the accessibility of the location. It is important to consider how fast a contaminated person will be able to reach the quarantine site before contaminating others. Thirdly, I prioritised economic costs of the location with lesser importance as it is one-off cost incurred at the developmental stage. Lastly, I ranked natural conservation the lowest of importance among the rest of the features as there are limited natural features found in Gombak. Additionally, it is does not align with a quarantine centre's main purpose of preventing the transmission of diseases.
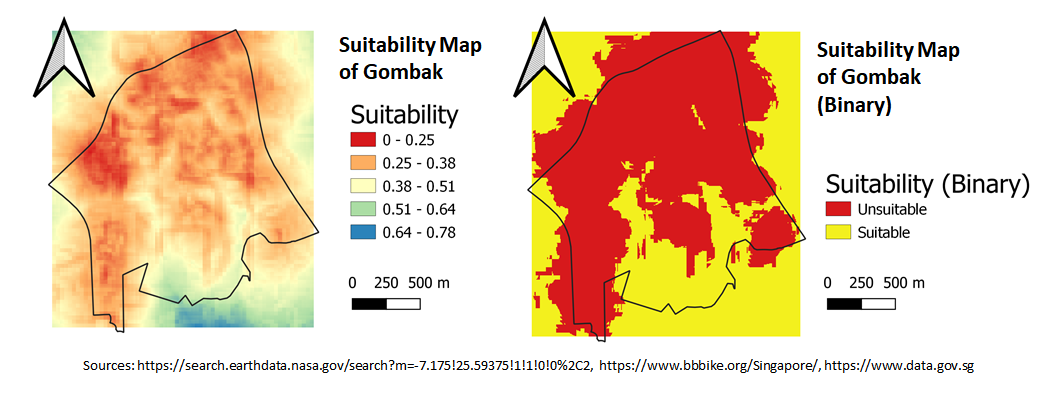
Gombak Map Layout With The Suitability Land Lots
Using the raster calculator with the following formula: ((1 - "Roads_Service_Tracks (Standardised)@1") * 0.254) + ((1 - "Slope (Standardised)@1") * 0.0.122)+ ("Buildings (Standardised)@1" * 0.532) + ("Natural (Standardised)@1" * 0.091), I created a suitability analysis raster. Further, I reclassified the Raster by table and obtained the binary values into areas that are unsuitable (equal to or below the suitability analysis raster mean of 0.446) and areas that are suitable (above the suitability analysis raster mean of 0.446).
The suitable plot of land that I would pick to locate the Communicable Disease Quarantine Centre would be in Southern Gombak (i.e. the large area of land indicated in yellow in the binary suitability map) which has an area greater than 283996.333 m². A final recommendation is that the centre also consider roads, buildings, natural features in the subzone at the Southmost of Gombak as we did not analyse if those features will affect the potential Quarantine Centre in South Gombak.


