SMT201 AY2019-20T1 EX2 Charmine Foo Zhi Min
Contents
The Task
In this exercise, you are tasked to identify a location suitable for building a National Communicable Disease Quarantine Centre. The selected site must be located at Gombak Planning Subzone, with a Contiguous Area of at least 10,000m2 and it must meet the following Decision Factors:
- Economic Factor: The selected site should avoid steep slope. This is because construction at steep slope tends to involve a lot of cut-and-fill and will lend to relatively higher development cost.
- Accessibility Factor: The selected site should be close to existing local roads, namely: service roads and tracks. This is to ensure easy transportation of building materials during the construction stage.
- Health Risk Factor: The selected site should be away from population i.e. housing areas and offices in order to avoid disease spreading to the nearby population.
- Natural Conservation Factor: The selected site should be away from forested land, park and water.
Data Sets
- Master Plan 2014 Subzone Boundary from URA.
- Roads, Buildings and Natural Features data from OpenStreetMap (OSM) data sets.
- ASTER Global Digital Elevation Model (GDEM) dataset jointly prepared by NASA and METI, Japan.
- Excel-based AHP library - AHP Template provided by SCB Associates
Part One: Gombak in 4 Views
Study Area: Gombak
For the purpose of this exercise, the Gombak Planning Subzone is extracted from the Master Plan 2014 Subzone Boundary from URA which consists of polygon featuring all the planning subzone data of Singapore. In order to do so, the “Select Features by Expression” is used on QGIS.
Gombak And The Target Roads
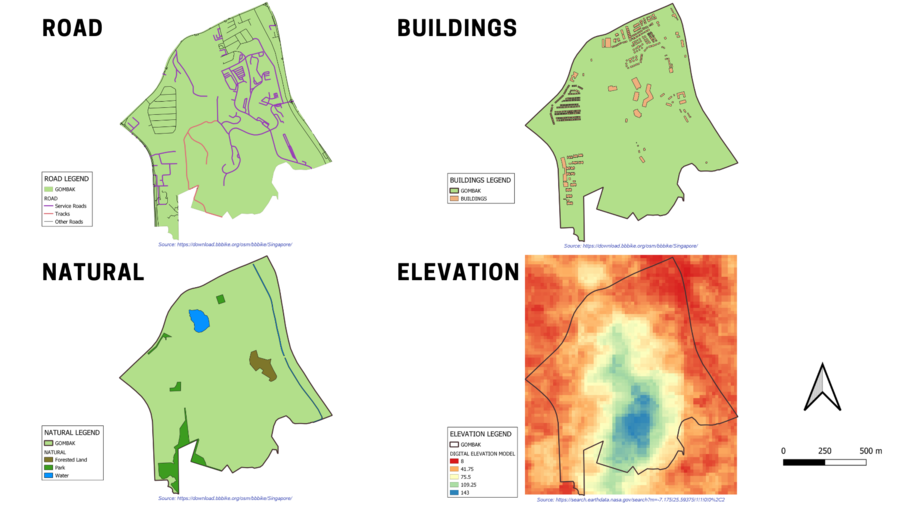
Using the “Clip” operation on QGIS, the Target Roads within the study area is extracted and allows for the Accessibility Decision Factor analysis as the selected site should be close to existing local roads (Service Roads and Tracks) to ensure the easy transportation of building materials during the construction stage. From the map layout above, the 2 main existing local roads are being colour coded (Purple – Service Roads, Pink – Tracks) and represented using a thicker stroke. Within Gombak, there are 2 Tracks with a total length of around 1861-metres and 199 Service Roads with roads such as Gombak Drive, Hillview Avenue, Bukit Panjang Link, Phoenix Avenue, MINDEF Carpark, Lor Ah Thia, Bukit Batok Driving Centre, and Bus Lanes.
Gombak And The Buildings
Using the “Clip” operation on QGIS, the Buildings within the study area is extracted and allows for the Health Risk Decision Factor to be assessed as the selected site should be away from places such as the Housing Areas and Offices to prevent diseases from spreading to the nearby population. From the map layout above, there is a total of 527 buildings within Gombak, with a variety of building type such as Residential, Public, Train Station, Garage, Place of Worship, Construction, and Clinic.
Gombak And The Target Natural Features
Using the “Clip” operation on QGIS, the Target Natural Features within the study area is extracted and allows for the Natural Conservation Decision Factor to be studied as the selected site should be away from forested land, park and water. From the map layout above, the 3 main types of natural features are Forested Land, Park and Water. Each of them are being colour coded (Forested Land – Brown, Park – Green, Water – Blue). In this study area, there is a total of 8 features, with 1 forest, 4 parks (Pavilion Playground, Pavilion P/G II, Phoenix Park and Bukit Batok Town Park) and 3 water features.
Gombak And The Digital Elevation
In order to look into the Economic Decision Factor to ensure that the selected site should avoid steep slope so as to prevent a lot of cut-and-fill and high development cost, the Digital Elevation Model (DEM) data which falls within the Gombak planning Subzone has to be extracted using the Clip “Raster by Extent” operations on QGIS. The lowest point of elevation in this study area is 8-metres and colour coded using Red whereas the highest point of elevation in this study area is 143-metres and colour coded using Blue. Majority of the Target Roads, Buildings and Target Natural Features are located in the lower point of elevation.
Part Two: Gombak in 4 Views (Proximity)
Prior to creating a proximity to the different layers to assess the 4 main Decision Factors and performing the “Raster Distance” computation on QGIS, there is a need to rasterise the Vector Layers (Roads, Buildings and Natural Features) using the “Raster (Vector to Raster)” operation as the Proximity (Raster Distance) requires the input GIS layer to be in the raster format.
Gombak And Proximity To The Target Roads Layer
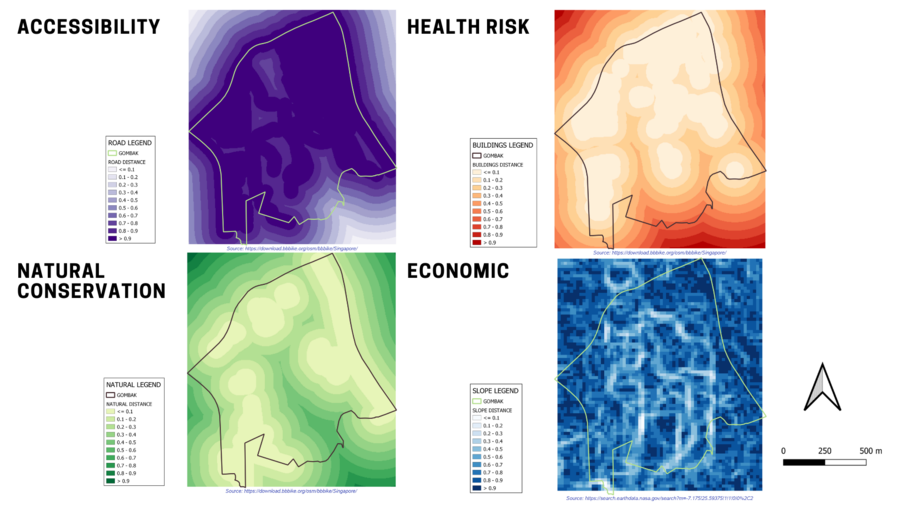
The legend of the Proximity To The Target Roads Layer indicates that the furthest distance from the roads is 708.678-metres. With a resolution of 5-metres by 5-metres, the darker the shade of black, the closer it is to the existing local roads, which indicates an increase in Accessibility.
Gombak And Proximity To The Buildings Layer
The legend of the Proximity To The Buildings Layer indicates that the furthest distance from the buildings is 826.62-metres. With a resolution of 5-metres by 5-metres, the darker the shade of black, the closer it is to the buildings, hence, increasing the Health-Risk Factor. Thus, the suitable land lot should be within the lighter shade of black.
Gombak And Proximity To The Target Natural Features Layer,
The legend of the Proximity To The Target Natural Features Layer indicates that the furthest distance from the natural features is 863.669-metres. With a resolution of 5-metres by 5-metres, the darker the shade of black, the closer it is to the natural features. Thus, the suitable land lot should be within the lighter shade of black so that these natural features will not be affected and will be conserved.
Gombak And The Slope Layer
In order to compute a Slope Layer from the DEM Layer, the “Slope” operation of QGIS is used. The legend of the Slope Layer shows that the minimum and maximum values of the slope values are 0 and 36.4308 degrees respectively. The grids with darker black indicate locations with relatively gentler slope, whereas the lighter black grids indicate locations with relatively steeper slope. Thus, the suitable land lot should be within the darker shade of black so as to avoid cut-and-fill and high development cost.
Part Three: Gombak in 4 Views (Criterion Scores)
In order to calculate the Criterion Scores of each factor layer, there is a need to first standardise the Proximity Analysis results using the Criteria Standardisation Technique of Min-Max.
Formula: MM(Xij)=(Xij-Xmin)/(Xmax-Xmin)
For this exercise, the maximum proximity (furthest distance) and the highest slope elevation will be represented by Xij.
There is also a need to ensure that the direction of standardisation is the same across the 4 different decision factors, for instance, the suitable land lot(s) must have a gentler slope and smaller proximity to roads and a larger proximity to both the buildings and natural features.
Because of the change in direction, the formula below is used to calculate the Criterion Scores for each of these factor layers.
Buildings & Target Natural Features:
MM(Xij)=(Xij-Xmin)/(Xmax-Xmin)
Target Roads & Slope:
MM(Xij)= 1 - (Xij-Xmin)/(Xmax-Xmin)
Using the “Discrete Interpolation” properties function, with an Equal Interval of 10 Classes, the Criterion Scores for each of the factor layers ranges from 0 to 1 and the darker the shade of colour, the more suitable it is for the land lot(s) to be chosen.
Criterion Scores Of The Target Roads Layer
The Accessibility Decision Factor Criterion Score for the Target Roads Layer indicates that those areas with a higher Criterion Score and darker shade of purple are the areas which are closest to the existing local roads. This increases the suitability for the land lot(s) to be selected.
Criterion Scores Of The Buildings Layer
The Health Risk Decision Factor Criterion Score for the Buildings Layer indicates that those areas with a higher Criterion Score and darker shade of orange are the areas which are furthest away from the buildings. This increases the suitability for the land lot(s) to be selected.
Criterion Scores Of The Target Natural Features Layer,
The Natural Conservation Decision Factor Criterion Score for the Target Natural Features Layer indicates that those areas with a higher Criterion Score and darker shade of green are the areas which are furthest away from the natural features. This increases the suitability for the land lot(s) to be selected.
Criterion Scores Of The Slope Layer
The Economic Decision Factor Criterion Score for the Slope Layer indicates that those areas with a higher Criterion Score and darker shade of blue are the areas with gentler slopes. This increases the suitability for the land lot(s) to be selected.
Part Four: AHP Matrix And Result Report
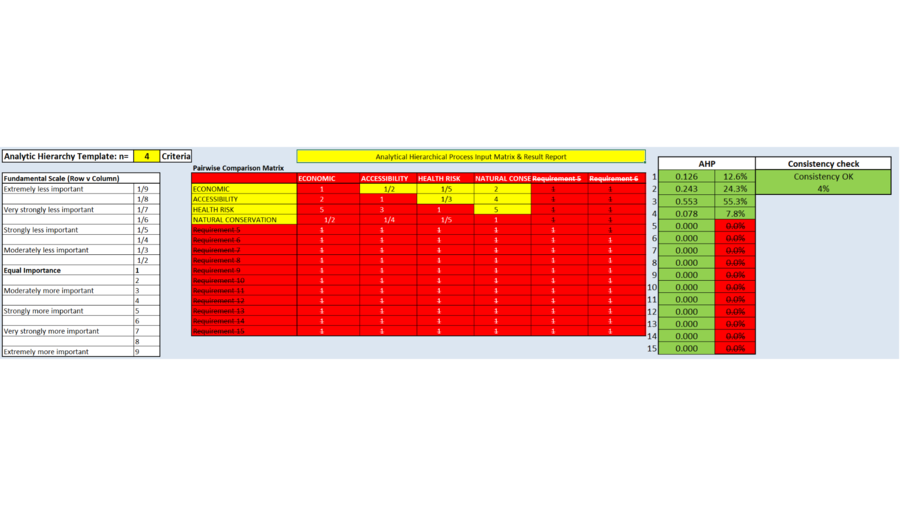
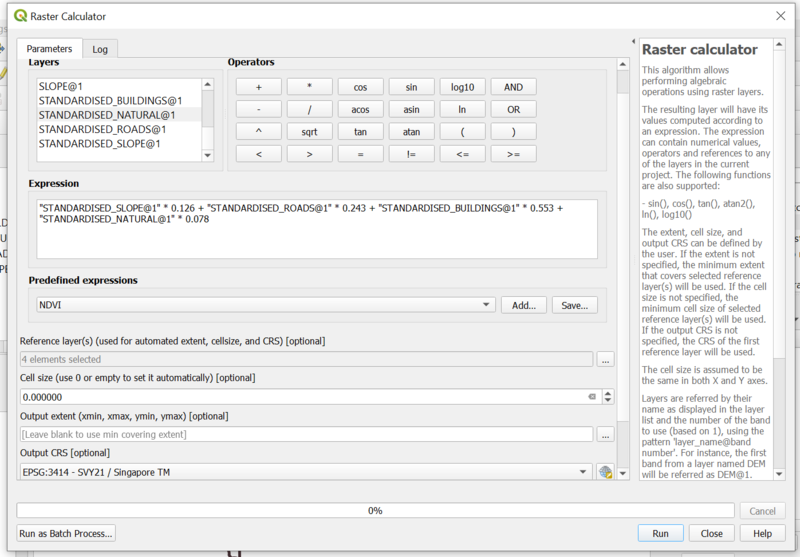
The Analytical Hierarchical Process (AHP) Input Matrix & Results Reported generated using the Excel-based AHP library - AHP Template provided by SCB Associates uses the Pairwise Comparison Metrix to determine the importance of each Decision Factors. From the results in the table above, the Health Risk Factor (Buildings) holds the highest weightage of 55.3% weightage, followed by the Accessibility Factor (Roads) with 24.3% weightage, the Economic Factor (Slope) with 12.6% weightage and the Natural Conservation Factor holding the least weightage of 7.8%. Overall, the Consistency Check is 4%, which is below the maximum percentage of 10%. This means the importance that each factor plays in contributing to the suitable land lot(s) is accurate.
Part Five: Gombak Map Layout With The Suitability Land Lot(s)
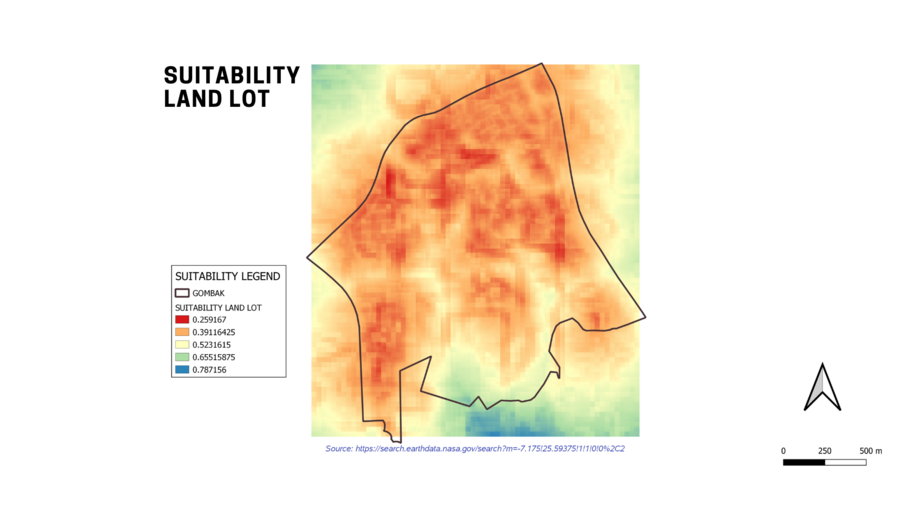
From the Suitability Map above, regions in the colours Red and Orange has the least suitability for the National Communicable Disease Quarantine Centre to be located and regions in the colours Blue and Green has the highest suitability for the National Communicable Disease Quarantine Centre to be located.
The final selected land lot in the map above is the most suitable for the National Communicable Disease Quarantine Centre to be located since it is located within a contiguous area of at least 10,000m2 and meets all the Decision Factors.
