SMT201 AY2019-20T1 EX1 Tan Jian Hao
Contents
Part 1: Thematic Mapping
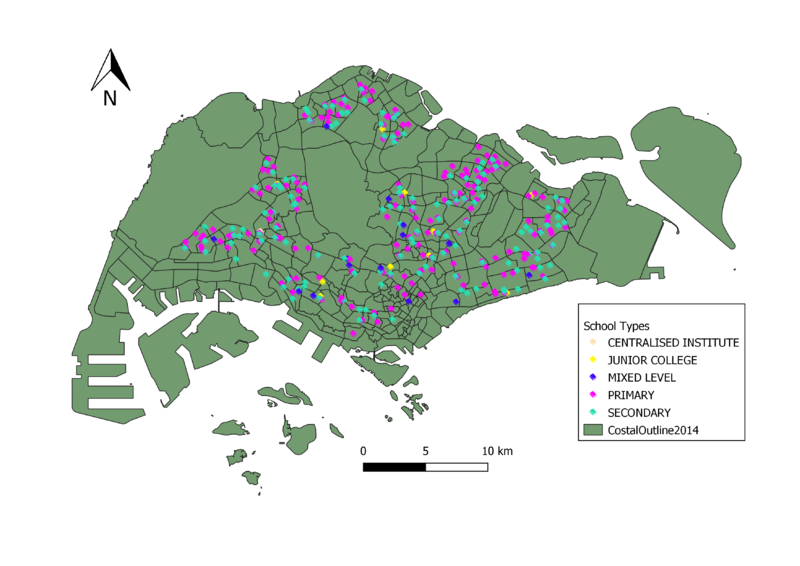
Distribution of School types
The information of the school was geocoded with OneMap API using python. This will allow us to get the location for each school. The information is categorized by different level of school. Hence the colour represents school types like primary and secondary level
Hierarchy of Road network
In order to show the road network system of Singapore, the road type is categorized and differentiate by colour and thickness. This show the clear indication of which type of road such as expressway and major road
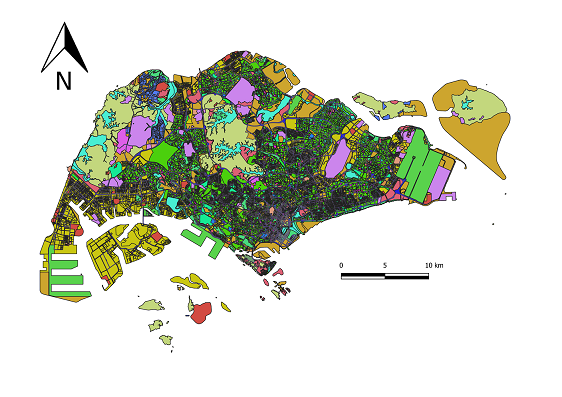
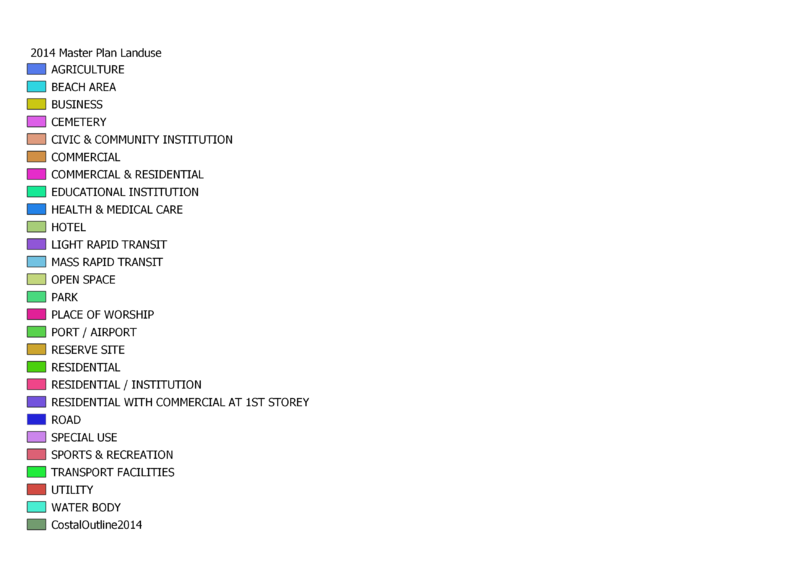
2014 Master Plan Landuse in Singapore
The master plan was used to show a different area of land used in Singapore. The colour is group by Symbology Categorized. This gives the user a clear representation of lands used in Singapore
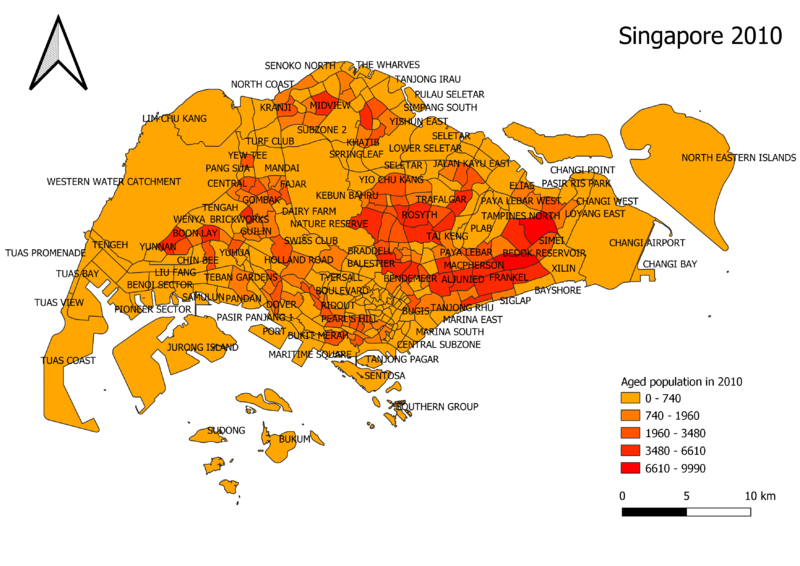
Age Population (age 65 and above) in 2010 and 2018
In order to find out the population of people aged 65 and above in the year 2010 and 2018, Symbology Graduated is using to gauge which areas are dense. The darker colour area shows that the area has more people age 65 then the lighter colour area. To sum this analysis, there are slightly more people age 65 in 2018 than in 2010.
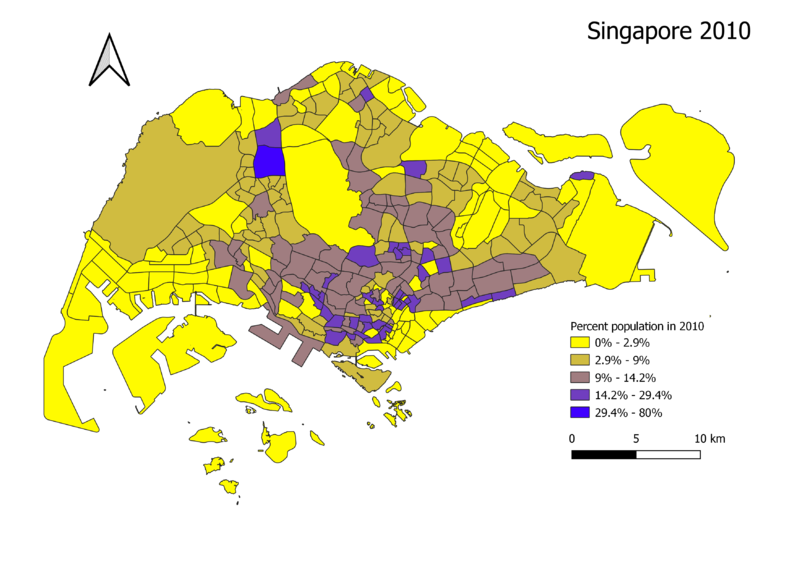
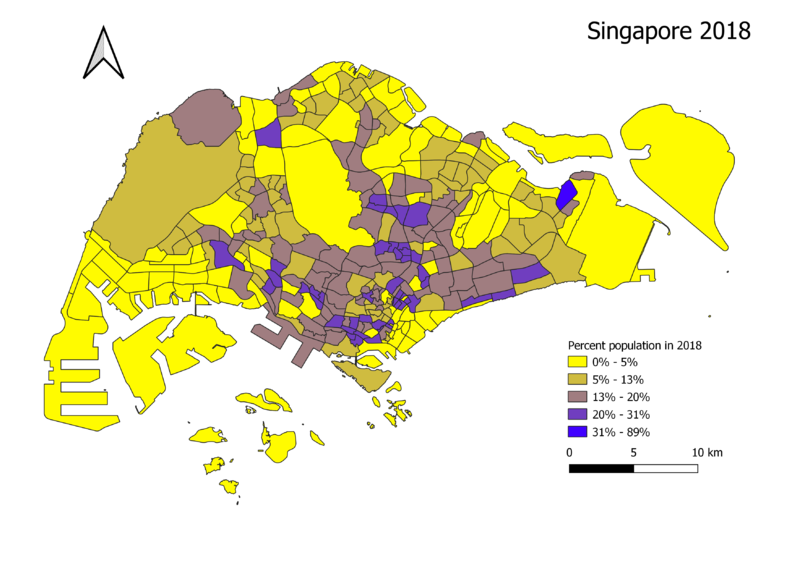
Proportion of Aged Population (age 65 and above) in 2010 and 2018
Calculating the population in percentage, it is evident to see the increase in percentage in the areas. Same as the previous image, the darker colour show a greater percentage of people age 65.
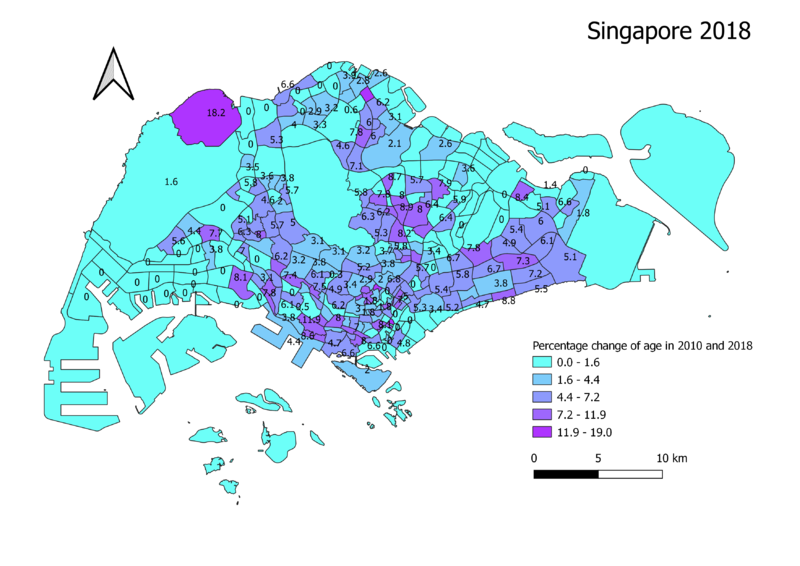
Percentage Change of Aged Population
Although there is an increase in most areas, the increase was small from 2010 to 2018. This concludes that it is almost natural to see a steady increase in age over the years.
