SMT201 AY2019-20G2 EX2 Siti Salihah Binte Mohamed Rilvan
Contents
About
Identifying a location suitable for building a national Communicable Disease Quarantine Centre whereby it is located at Gombak. The selected area needs to be at least 10,000-meter square and it has to meet the 4 decision factors - economic factor, accessibility factor, health risk factor and natural conservation factor.
| Factor | Corresponding Data | Rationale
|
|---|---|---|
| Economic | Slope | Steep slopes lead to higher development cost |
| Accessibility | Roads: Service Roads and Tracks filtered | Ensuring easy transportation of building materials during construction |
| Health Risk | Buildings | Disease should not be able to spread to nearby population |
| Natural Conservation | Natural Features: forest, park and water | Not to disrupt natural reserves |
Map Layouts
1: Study Area and Target Roads
This gives a rough idea in determining the different areas within Gombak which is highly accessible as the selected site should be close to service roads and tracks. The light green layer refers to the Gombak layer.
2: Study Area and Buildings
This map layout shows where the buildings are located within Gombak. We need to make sure the selected site to build the Communicable Disease Quarantine Centre is far away from the population. When there are buildings, it means the area is densely populated and we should avoid it.
3: Study Area and Target Natural Features
This shows the area within Gombak which are forested, parks or water. Since the selected site needs to be far away from those areas, by looking at this map, we can determine the suitable areas which we can build the quarantine centre by taking the natural conservation factor into consideration.
4:Study area and Digital Elevation
The darker the shade of black, the less steep the slope is and the more suitable the specific area for the building of the quarantine centre. This helps to take the economic factor into consideration.
Map Layouts(Proximity)
1:Study Area and Proximity to Target Roads
The darker the shade of black, the closer the distance of the particular point from service roads and/or tracks. The closer the distance, the more accessible the particular area is, which is what we want when building the quarantine centre as it helps to ensure easy transportation of building materials during the construction stage.
2:Study Area and Proximity to Buildings
The lighter the shade of black, the further the distance of the particular point from buildings. As we need to consider the health risk factor, we need to make sure the quarantine centre will be far away from buildings (as it needs to be far away from the population). In this case, the areas which the colour is the lightest would be the most preferred.
3:Study Area and Proximity to Target Natural Features
Similar to 2, the lighter the shade of black, the further the distance of the particular point from target natural features such as forested land, park and water. As we do not want the building of the new quarantine centre to disrupt the nature reserves, we have to select the site which is far from the target natural features. Thus, the area which the shade of black is lightest (closest to white) is the most preferred.
4:Study Area and Slope
The lighter the shade of black, the steeper the slope in that particular region which is more undesirable. We try to avoid areas which have lighter shades or white in colour as it will lead to higher development cost.
Map Layouts (With Criterion Score)
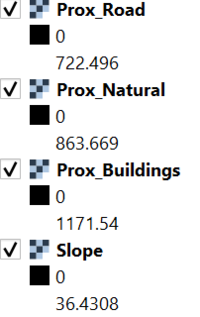
In order to determine the selected site, we need to consider all the 4 factors as discussed above. However, the range of each of the layer when it comes to proximity and steepness is not the same as shown below. We need to find a way to standardise.
For standardisation, I used the Min-Max criteria standardisation technique. Using the raster calculation function, I used the formula, (Proximity layer - Minimum value of proximity)/(Maximum value of proximity - Minimum value of proximity) in general.
For the standardisation of the slope layer, it is similar but (Slope - Lowest steepness value)/(Highest steepness value - Lowest steepness value).
As such, my ranges of the 4 layers is between 0 and 1 (standardised across all layers).
The map layouts showing the criterion scores after standardisation is as shown below. Although, a lighter shade of red means closer to feature and darker shade of red means further away from a feature, my aim is to make sure that the higher value means more desirable for choosing it as a site to build the quarantine centre.
Keeping that in mind, for economic, health risk and natural conservation factors, the further the distance, the greater the value which makes sense as they are desirable. However, for the accessibility factor, it is preferable for the site to be close to the roads. It does not make sense to assign a higher value for further distance when it is less desirable. Hence, for roads, after standardisation, I had to inverse by subtracting the standardised proximity of road from 1 to ensure a higher value is assigned to closer distance.
1:Criterion Score of Accessibility Factor
| Factor | Which layer is standardised? |
|---|---|
| Accessibility Factor | Proximity of Roads |
From 1, we can see that a higher criterion score is assigned to areas nearer the roads as building the quarantine centre near the roads and tracks are preferred. It is also obvious that there are road networks almost throughout the Gombak area which is a good thing.
2:Criterion Score of Health Risk Factor
| Factor | Which layer is standardised? |
|---|---|
| Health Risk Factor | Proximity of Buildings |
The lighter shades of red mean presence of buildings. Buildings are interspersed almost throughout the Gombak area and we need to be careful about that so as to ensure the safety of the general public at Gombak.
3:Criterion Score of Natural Conservation Factor
| Factor | Which layer is standardised? |
|---|---|
| Natural Conservation Factor | Proximity of Natural Features |
In 3, there is an obvious dark red line branching within the Gombak area which indicates the area which is safe to build the quarantine centre by only considering the natural conservation factor.
4:Criterion Score of Economic Factor
| Factor | Which layer is standardised? |
|---|---|
| Economic Factor | Slope |
When considering the economic factor, it is best to build the quarantine centre at the area in which the points are in dark red as they are far away from steep slopes and will not incur much development cost.
Analytical Hierarchical Process Input Matrix
While we have to consider all the 4 factors when choosing a site to build the quarantine centre, some factors are more important while some are less important. As such, we need to assign a weight to each factor. To do that, I used the AHP matrix table.
AHP Input Matrix:
Upon filling up the matrix, the results are automatically generated showing us the weight for each factor. We need to make sure the consistency result is below 10% before we proceed:
As you can see from the matrix above, I assigned health risk as the most important factor, followed by accessibility, economic and natural conservation. I chose health risk as the most important factor as if it is not fulfilled, it defeats the whole purpose of building a quarantine centre when it is exposed to the population.
Suitability Land Plot
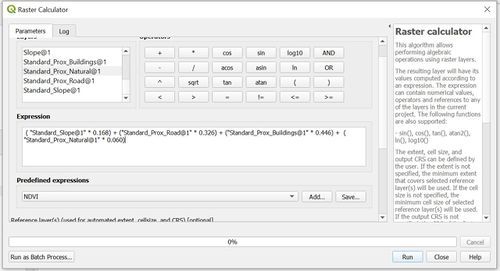
Here is how I consolidated all the 4 factors in QGIS with making use of the AHP data to give the weight according to my proposed level of importance for each factor:

After consolidating all the 4 factors, here is the map layout showing the overall criteria scores:
From what I consolidated, since the areas which appear green or bluish have a higher overall criterion score, I can roughly determine which areas are more suitable for the building of the quarantine centre.
My proposed suitability land plots are as shown below:
The area of the land plot in purple is 93815.033 metre-square while the area of the land plot in dark blue is 107882.908 metre-square. Both of them fulfil the minimum size requirement of 10 000 metre-square.
References
1. Master Plan 2014 Subzone Boundary from URA
2. Roads, buildings and natural features data from OpenStreetMap (OSM) data sets
3. ASTER Global Digital Elevation Model (GDEM) dataset jointly prepared by NASA and METI, Japan

