SMT201 AY2019-20G2 EX2 Kim Chang Heon
Jump to navigation
Jump to search
| OVERVIEW | PROXIMITY MAPS | CRITERION SCORES | AHP | RECOMMENDATION |
|---|
| BUILDINGS |
|---|
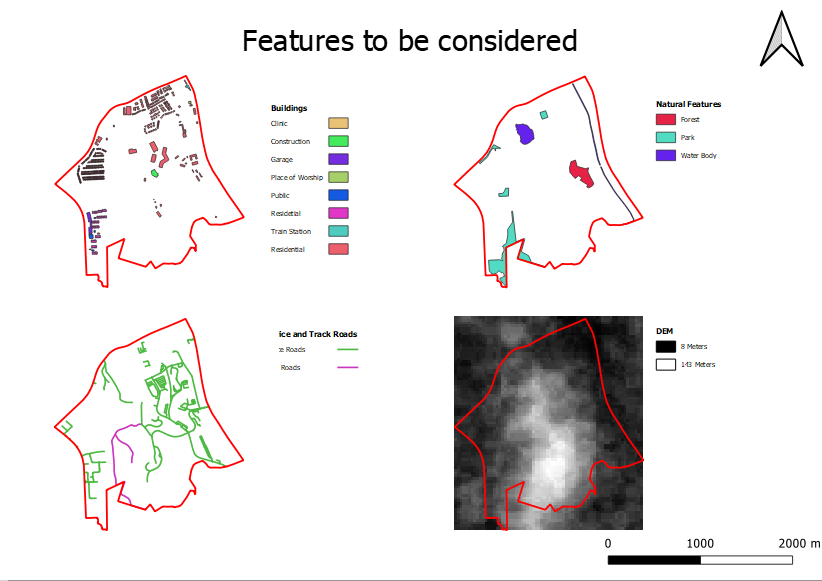
| By clipping the buildings layer provided by OSM with the subzone planning area of Gombak, the layer containing only the buildings within the Gombak planning area was achieved. From there, by using the symbology function in QGIS, buildings with different uses were classified to achieve the output map on the top left. |
| ROADS |
|---|
| First, road data from OSM was clipped with the Gombak planning subzone area. Then, only the roads that were Service and Track roads were selected using attribute tables, and then exported into the geopackage as a new layer. This layer was then classified into Track (purple) and Service (green) roads separately as shown in the bottom left map using symbology. |
| NATURAL FEATURES |
|---|
| Similar to the past 2 maps, the OSM data was clipped with the planning boundary of Gombak, and then classified using symbology. Attribute table was checked to see if the natural features consisted of forests, parks and water bodies. |
| DIGITAL ELEVATION MODEL |
|---|
| Using the elevation data provided during lessons (ASTER GDEM), the Raster function 'Clip Raster by Extent' was used with the extent of Gombak's planning area. The output pixel size was set to 30 by 30 meters as it was the limitation of the data provided. This resulted in the map in the bottom right, which depicts the elevation of Gombak. |
