SMT201 AY2019-20G1 Ex2 Luo Haonan
Contents
- 1 Part One - A Map Layout with Four Views showing Roads, Buildings, Natural Areas and Elevation
- 2 Part Two - A Map Layout with Four Views showing Proximity Raster with Roads, Buildings, Natural Areas and Slope Raster layer
- 3 Part Three - A Map Layout with Four Views showing the Criterion Scores of Each Factor Layers
- 4 Part Four - An Analytical Hierarchical Process Input Matrix and Result Report
- 5 Part Five - Sutability Land Lots
Part One - A Map Layout with Four Views showing Roads, Buildings, Natural Areas and Elevation
Map View(Buildings)
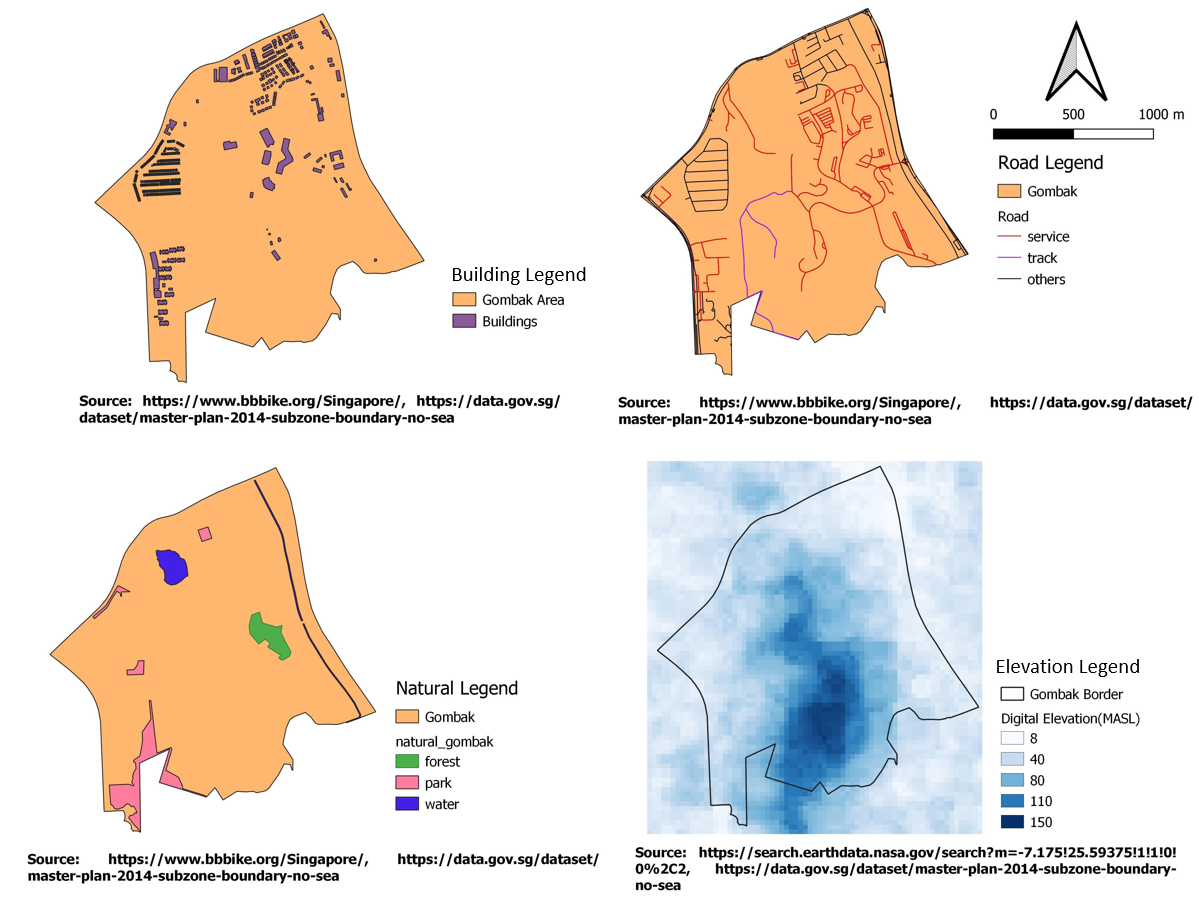
Since the selected site should be away from the population, the suitable lot will probably be situated at the southern part of Gomabk by looking at the building layout alone.
Map View(Roads)
Since the project specification stated that the selected site should be close to local roads such as service and tracks. I have labeled other types of roads such as primary and secondary roads in black, they will not be used in the suitability analysis later. For service and tracks types of road, I am using red to represent in red and purple respectively.
Map View(Natural)
The natural features are located around the northern, eastern and western parts of Gombak. The forest areas are represented in green, the park is represented in pink and the water is represented in blue. By looking at the Natural feature alone, the suitability lots will probably be situated in the southern part of Gombak.
Map View(Digital Elevation)
In the digital elevation, darker color represents the highly elevated area, while the lighter color represents the low-lying area. The map shows that the southern part of Gombak is a highly elevated area which will incur more economic cost if the selected site is being built here. This also might be the reason why this area is not populated with buildings or roads.
Part Two - A Map Layout with Four Views showing Proximity Raster with Roads, Buildings, Natural Areas and Slope Raster layer
Map View(Buildings)
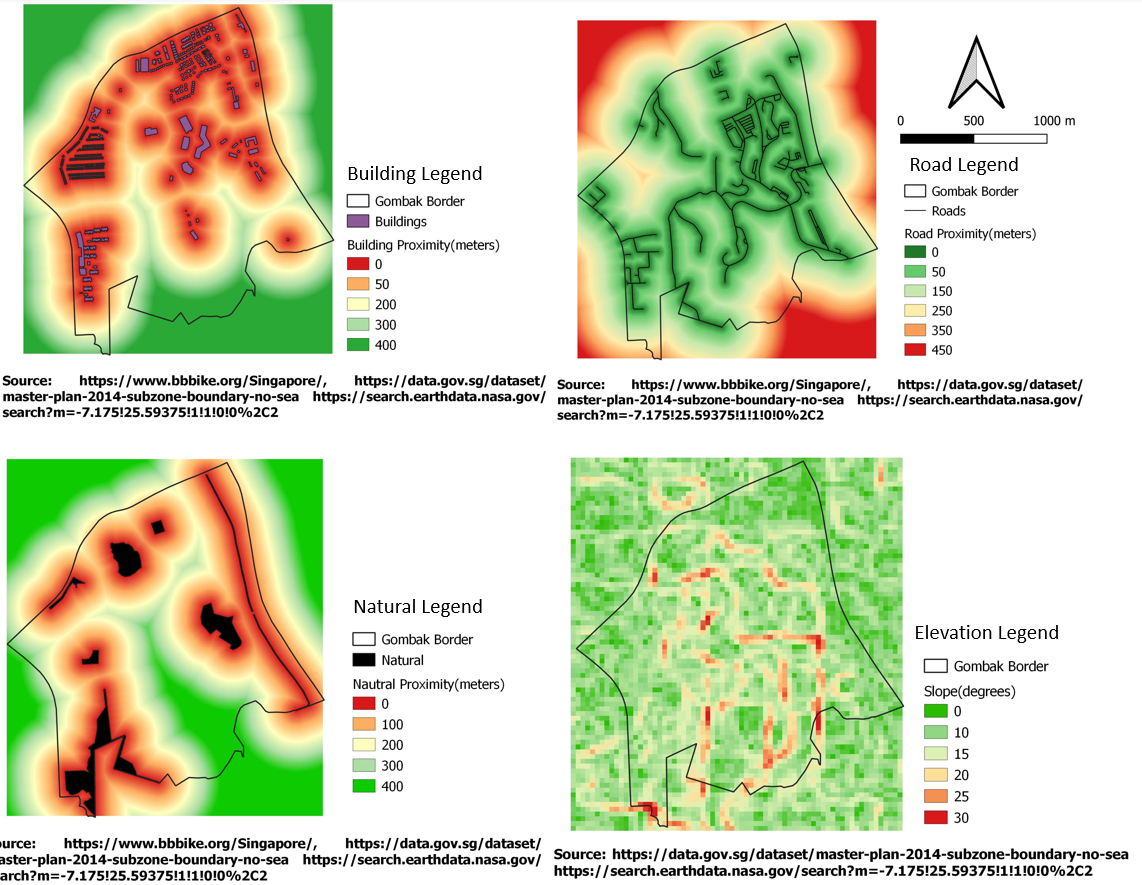
Min = 0 meter Max = 826.62 meters
The specification stated that the quarantine center should be away from populated areas such as office and schools, thus area which are at least 250 meters away from the buildings are indicated with green. Areas that are lesser than 200 meters will be labeled with a reddish color, the more reddish it is, the closer to the buildings.
Map View(Roads)
Min = 0 meter Max = 768.8464965820312 meters
The specification stated that the quarantine center should be close to the service and tracks type of roads, thus areas which are within the range of 150m is represented in green while areas which are further than 250 meters are represented in red.
Map View(Natural)
Min = 0 meter Max = 863.669 meters
Similar to the building view, the specification stated that the quarantine center should be away from natural features such as parks and water. This is to protect the natural features in the Gombak area, and it also avoids the virus from cross-infecting with animals or contaminating the source of water. Thus, similar to the building layout, area which are at least 250 meters away from the natural features is indicated with green. Areas that are lesser than 200 meters will be labeled with a reddish color, the more reddish it is, the closer to the natural feature.
Map View(Digital Elevation)
Min = 0 degree Max = 36.6781 degrees
The level of the slope in this raster is mainly being represented with 3 colors, green represents low-lying land which is lesser than 15 degrees, yellow represents medium elevated land which is between 15-20 degrees, red and orange are being used to represent highly elevated lands which are more than 20
Part Three - A Map Layout with Four Views showing the Criterion Scores of Each Factor Layers
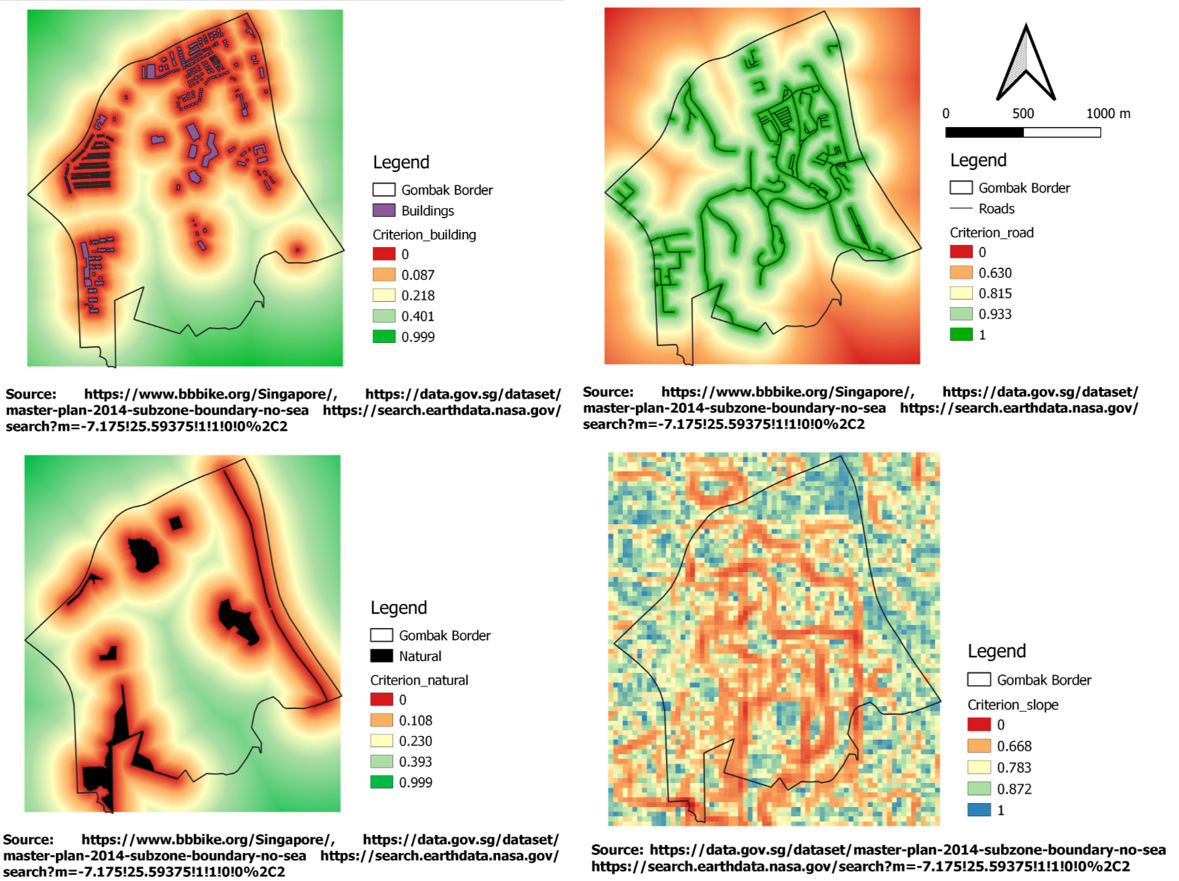
Criterion Score Technique Applied: Min-Max
Map View(Buildings)
Criterion Scores Formula: (X - 0 meters) / (826.62 meters - 0 meter) In this view, the area that has lower proximity to buildings is further away from their nearest buildings, this will show a higher criterion score which, in turn, shows that it has less health risk and thus is more desirable to build the quarantine center there.
Map View(Roads)
Criterion Scores Formula: 1 - (X - 0 meter) / (768.8464965820312 meters - 0 meter) In this view, the area that is closer to roads will show a higher criterion score which, in turn, shows that it has better accessibility and thus is more desirable to build the quarantine center in that area. The reason for using one to deduct the standardization result is because areas that are further away from the roads should get a lower score which is the opposite of other criteria such as building and natural features.
Map View(Natural)
Criterion Scores Formula: (X - 0 meter) / (863.669 meters - 0 meter) In this view, similar to the building view, the area that has lower proximity to natural features are further away from their nearest natural features, this will show a higher criterion score which, in turn, shows that it has less risk of cross-infection and effect on nature, and thus is more desirable to build the quarantine center there.
Map View(Digital Elevation)
Criterion Scores Formula: 1 - (X - 0 degree) / (36.6781 Degrees - 0 degree
The standardization score for the digital elevation is calculated as (1 - Standardised Results of Proximity to Slope), thus raster with low elevation will be given a higher standardization score. This is because it is easier and less costly to build the center on a gentle slope compared to a steep slope.
Part Four - An Analytical Hierarchical Process Input Matrix and Result Report
I believe that the health risk factor is the most important criteria in deciding where should be the selected site for Quarantine center because the sole purpose of a Quarantine center is to keep the virus away from people. Thus, I give this factor an AHP score of 0.444. For the second most important factor, I am torn between Accessibility and Nature due to a few reasons. Firstly, keeping a quarantine center far away from natural features is to prevent damages to the natural features, and the virus from cross-infecting with animals and contaminating the water resources which will cause widespread diseases. However, accessibility is also very important as it helps to move patients to the center easier and faster and helps the transportation of resources during the building and maintenance of the center. Therefore, I assigned both factors AHP score of 0.222. The least important factor is the economic factor which only affects the economic cost of the center, thus I assigned 0.111 to the economic factor.
Part Five - Sutability Land Lots
Formula for generating raster to evaluate suitability by using raster calculator: ("Criterion_Slope@1"*0.111)+("Criterion_Building@1"*0.444)+("Criterion_Road@1"*0.222)+("Criterion_Natural@1"*0.222)
Sutability Map 1:
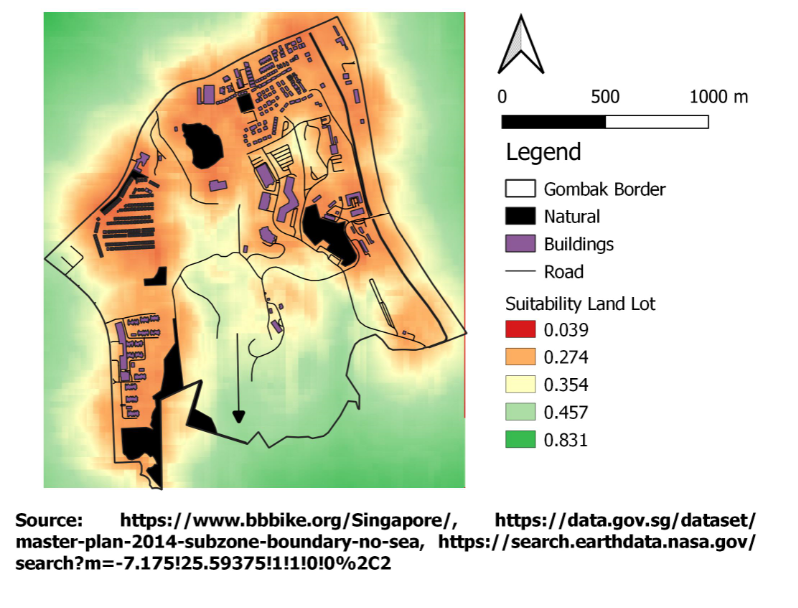
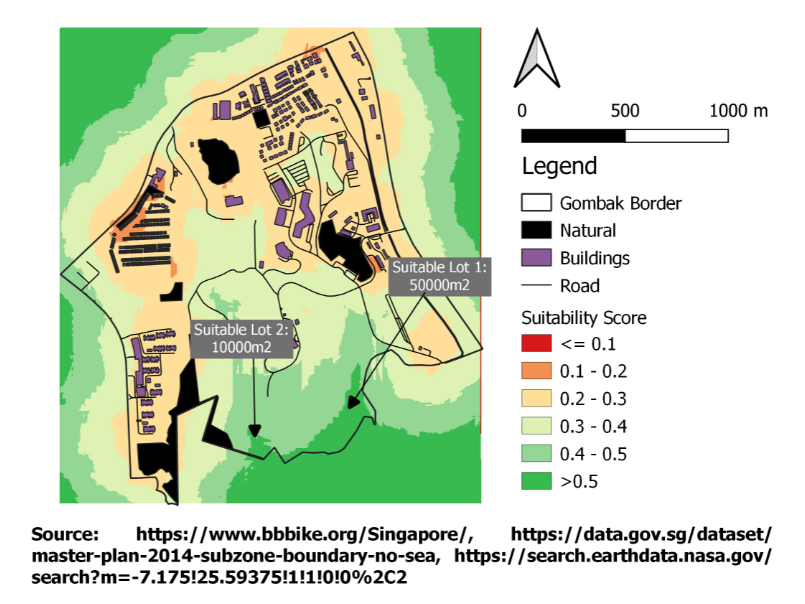
The map above shows a huge area in the southern part of Gombak is greenish. This means that the score of that area is above 0.4 which is the 50% mark of the total score. The more greenish the area, the more suitable it is for the quarantine center. However, it is not intuitive to eye on which is the most suitable area for the quarantine center. Therefore, I decided to add more bins and change interpolation to discrete to indicate the best area for the center clearly.
Suitability Map 2:
In my second suitability map, we can clearly see that the best suitable area for building the quarantine center is near the southern border of Gombak. There are 2 suitable lots, the first lot covers an area of 50000 meters square and the second lot covers an area of 10000 meters square.
Limitation: Although both areas meet the criteria of the quarantine center, the calculation only considers features within Gombak and does not consider features besides the border of Gombak. This might cause viruses spread to other regions if the quarantine center is built at the border of Gombak and very near to populated areas of another that shares this border with Gombak. However, this consideration is out of the scope of this project.
