SMT201 AY2019-20G1 Ex1 Yiap Mei Lin Andrea
Part 1: Thematic Mapping
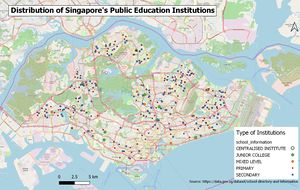
Distribution of Public Education Institution
In terms of visual representation, I used different sizes and colours to represent the various institutions. Therefore, at a glance we can see that there's only one centralised institution and both the primary and secondary schools are well spread out in all areas. Overall, there are lesser schools in the south compared to other parts of Singapore.
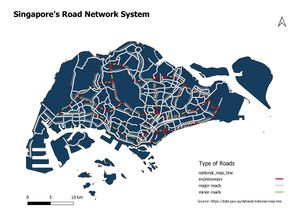
Hierarchy of Singapore's Road Network System
I classified the roads by their symbol ids.
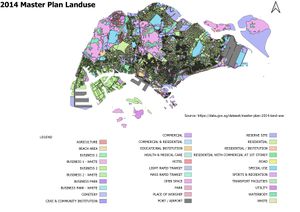
2014 Master Plan Landuse
Part 2: Choropleth Mapping
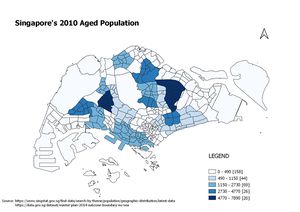
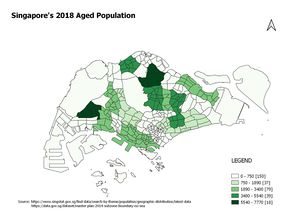
Aged population (+65) in 2010 and 2018
| 2010 | 2018 |
|---|---|
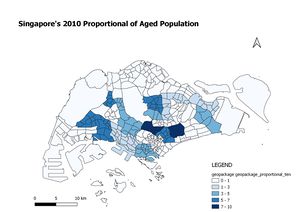
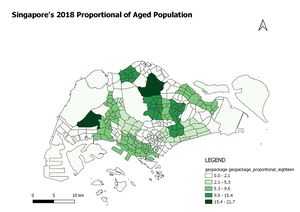
Proportional of aged population in 2010 and 2018
| 2010 | 2018 |
|---|---|
Percentage change of aged population between 2010 and 2018
I filtered out the 2010 and 2018 data from the original data and saving it as a geopackage. From there, I filtered out the age 65 and above by using this code: "AG" LIKE '65%' OR "AG" LIKE '7%' OR "AG" LIKE '8%'. Afterwards, I joined it to the subzone layer to vizualise the aged population map. For the proportional maps, I tabulated the total subzone population then divide by the total aged population.
