SMT201 AY2019-20G1 EX2 Tan Kin Meng
Contents
- 1 Objective: Identify a location suitable for building a national Communicable Disease Quarantine Centre in Bukit Gombak (Singapore)
- 2 Target roads, Buildings, Target Natural Features and Digital Elevation
- 3 Proximity and slope
- 4 Criterion scores
- 4.1 Brief overview of criterion scores and how they are obtained
- 4.2 Economic factor: The selected site should avoid steep slope. This is because construction at steep slope tends to involve a lot of cut-and-fill and will lend to relatively higher development cost
- 4.3 Accessibility factor: The selected site should be close to existing local roads, namely: service roads and tracks. This is to ensure easy transportation of building materials during the construction stage
- 4.4 Health risk factor: The selected site should be away from population i.e. housing areas and offices in order to avoid disease spreading to the nearby population
- 4.5 Natural conservation factor: The selected site should be away from forested land, park and water
- 5 Analytical Hierarchical Process (AHP) analysis
- 6 Suitability land lot
Objective: Identify a location suitable for building a national Communicable Disease Quarantine Centre in Bukit Gombak (Singapore)
The selected site must be located at Gombak planning subzone, with a contiguous area of at least 10,000 m² and it must meet the following decision factors:
- Economic factor: The selected site should avoid steep slope. This is because construction at steep slope tends to involve a lot of cut-and-fill and will lead to relatively higher development cost.
- Accessibility factor: The selected site should be close to existing local roads, namely: service roads and tracks. This is to ensure easy transportation of building materials during the construction stage.
- Health risk factor: The selected site should be away from population i.e. housing areas and offices in order to avoid disease spreading to the nearby population.
- Natural conservation factor: The selected site should be away from forested land, park and water.
Target roads, Buildings, Target Natural Features and Digital Elevation
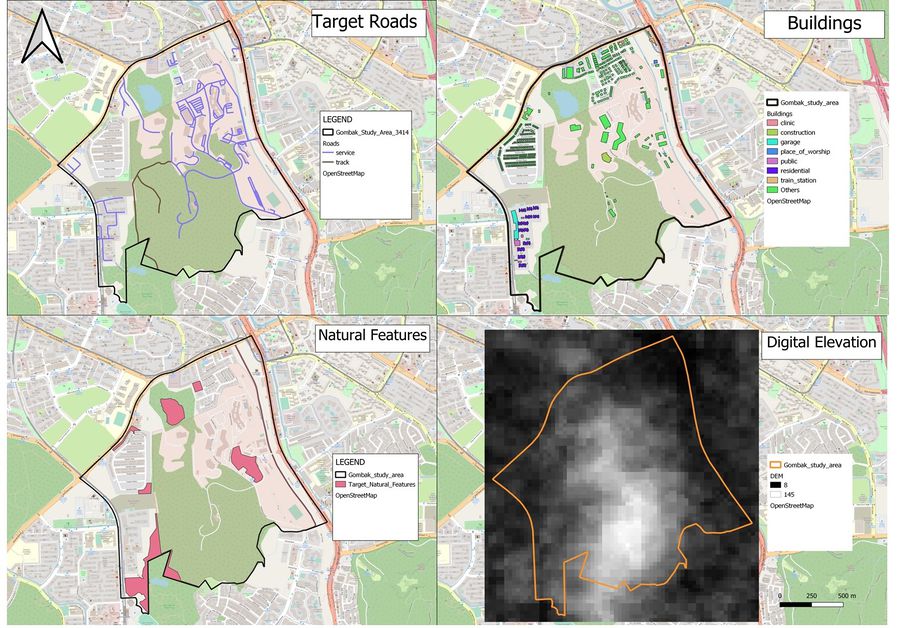
Four map views: Target roads, Buildings, Target Natural Features and Digital Elevation
Each layer was created by extracting the respective features and clipping them with the Bukit Gombak study area. The Bukit Gombak study area was extracted from the Master Plan 2014 Subzone Boundary from URA found on Data.gov.sg [Data.gov.sg].
All the spatial features such as buildings, parks and roads etc., henceforth, are extracted from [BBBike@Singapore].
Target roads
For the target roads layer, we are tasked to analyse only service roads and track. Hence, I extracted the service and track layers and clipped them with the Bukit Gombak study area, already extracted, to create the layer for target roads. As evident from the map, service road networks are more extensive in the north eastern parts of Bukit Gombak.
Buildings
For the buildings layer, there are only a few types of buildings in the area and they are namely garage, construction sites, residential areas and public institutions. However, there are many buildings that are categorized under “Others” and by using the Open Street Map view, I can identify that some of these land uses are used by the military. This is relevant for the analysis later as we need to be aware that we might be building the quarantine area in the military camp. As observed from the map, the buildings are scattered in the North, East and West areas but not the South.
Target Natural Features
For targeted natural features, I simply extracted the selected areas by clipping to the study area Bukit Gombak. They are sparsely distributed with 2 natural areas in the north east and small plots of natural features are also scattered in the south west.
Digital Elevation
For the digital elevation layer, it was created by extracting the ASTER Global Digital Elevation Model (GDEM) dataset jointly prepared by NASA and METI, Japan according to the study area Bukit Gombak. After which, I used singleband grey for band rendering to show the elevation of Bukit Gombak. The map shows that the elevation increases gradually from north to the south of Bukit Gombak and peaks in Bukit Panjang camp as seen in the Open Street Map (OSM). It should be noted that slope elevation are expressed in degrees.
Data for the Digital Elevation Model was obtained from: [2] and had been compiled by Professor Kam Tin Seong.
Proximity and slope
Four map views: Roads Proximity, Building Proximity, Natural Features Proximity and Slope
Brief overview of proximity and slope
For this section of analysis, the steps taken were to first rasterize each of the layer (roads, buildings, and natural features) and then with the rasterized layers I analyse the proximity (Raster --> Analysis --> Proximity (Distance)). The choice of the colors and band rendering were blues and discrete (instead of continuous) as I think that the proximity limits can be observed more clearly with discrete. Each of the layer’s distances were also calculated by quantiles and sorted into 5 classes. Analysing with quantiles allows us to observe more clearly what is the proximity range for the upper and lower quantiles, which will be beneficial in the analysis in this case. If we were to use equal intervals, the map will show equal colors up until the maximum value which may not exist within Bukit Gombak. Hence, quantiles are used for analysis in this case to identify the proximity for majority of the cases and identify the outliers in terms of proximity.
Proximity to target roads layer
As observed, most areas of Bukit Gombak are within 135.87 m away from the roads, this also means that most areas of Bukit Gombak are relatively accessible from the roads.
Proximity to buildings layer
As observed from the map, in the northern parts of Bukit Gombak, the buildings are densely positioned. As proximity to buildings affects the rate at which diseases spread, it may not be a feasible idea to build the quarantine area in the northern parts of Bukit Gombak. In contrast, in the southern parts of buildings layer, there are spaces which are further away from buildings (> 41.1metres) away from buildings. The furthest possible distance away from buildings is approximately around 400 metres (as estimated by using the identify features tool on the boundaries of Bukit Gombak). This must be taken into account in the selection of our quarantine site.
Proximity to target natural features layer
This factor aims to conserve natural features such as parks, forested land, and water areas. As observed in the map, it can be observed that most areas are less than 40 m away from a natural feature, with the maximum distance being 103.22 metres away from the nearest natural features, which are toward the south eastern part of Bukit Gombak.
The study area and slope layer
The slope affects the elevation which will, in turn, cause the development costs to be higher. Hence, slope should be avoided. Observing from the map, the elevated parts of the slope (as indicated by the white areas of the map), seem to be positioned in the central of Bukit Gombak and the peripheral areas of the map are flatter (as indicated by the darker areas). Hence, it might be more feasible to locate the site near the periphery of Bukit Gombak.
Criterion scores
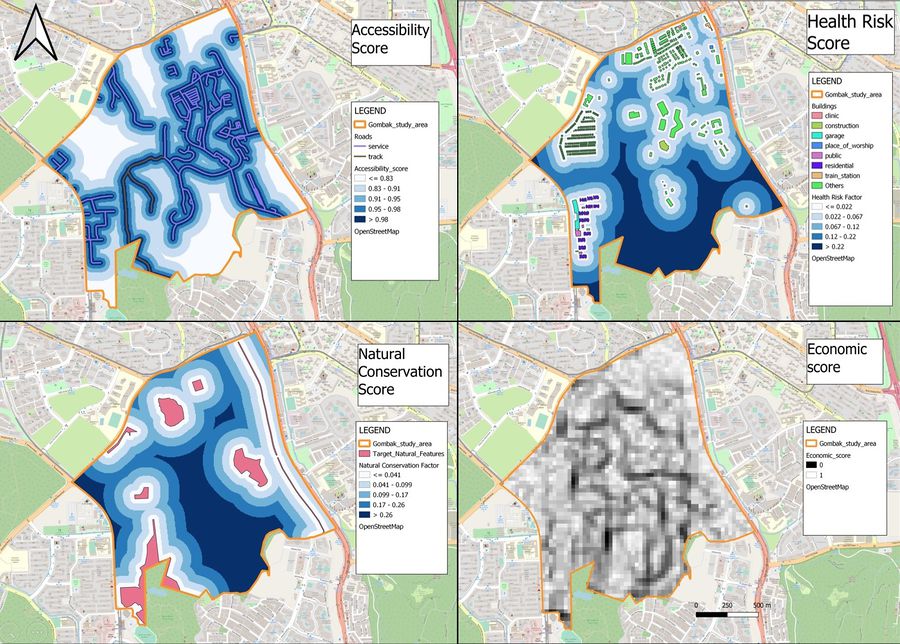
4 map views showing criterion scores: Economic factor, Accessibility factor, Health risk factor and Natural conservation factor
Brief overview of criterion scores and how they are obtained
To obtain the criterion scores for each layer, I standardized the respective proximity data of each layer with the formula below. This is implemented with the raster calculator.
Formula for standardization: (X – Minimum ) / (Maximum – Minimum)
However, the standardization process depends on the requirements of each layer as we must keep in mind that the standardized criterion scores will be used for analysis later, so we must make it consistent by representing high scores with the outcome we want.
From this perspective, we have: (1 – standardized slope criterion scores) and (1- standardized accessibility scores(roads)).
This is because we want to avoid high slopes and therefore want to assign low scores to high slope. We also want to build at places with high accessibility, and so we want short distances to have higher scores. Hence, we have to take the inverse of standardized scores for the aforementioned factors.
Economic factor: The selected site should avoid steep slope. This is because construction at steep slope tends to involve a lot of cut-and-fill and will lend to relatively higher development cost
Visually, it is evident that the colors of the slope are the inverse of the colors representing slope proximity. Now, the sites of Bukit Gombak with lower elevation has a higher score (near 1), while the sites with higher elevation receive lower scores (near 0), which is the intended outcome. As observed from the map, to reduce the costs of development, the periphery of Bukit Gombak are best sites for development.
Accessibility factor: The selected site should be close to existing local roads, namely: service roads and tracks. This is to ensure easy transportation of building materials during the construction stage
Visually, it is also evident that the colors representing the accessibility scores are the inverse of the colors representing the road proximity presented in the earlier section. Now, the less accessible sites (those with longer distances away from roads) receive a lower score (instead of higher) and the more accessible sites receive a higher score. The desired site to increase accessibility are diffused in Bukit Gombak as the road networks (service and track) are quite extensive, covering most parts of Bukit Gombak.
Health risk factor: The selected site should be away from population i.e. housing areas and offices in order to avoid disease spreading to the nearby population
For health risk factor, health risk scores are obtained by standardization and there are no visual differences as compared to the map on buildings proximity. For this section, the standardization has assigned higher scores to distances further away from buildings, which is the desired outcome since the further the quarantine site is from buildings, the less risk of the disease spreading. The desired site to reduce health risk is in the southern parts of Bukit Gombak.
Natural conservation factor: The selected site should be away from forested land, park and water
Similarly, in the case of natural conservation, the further away from forested land, parks and waters, the better. The standardized scores reflect the desired outcome and it can be seen that the desired areas for natural conservation are in the southern western parts of Bukit Gombak.
Analytical Hierarchical Process (AHP) analysis
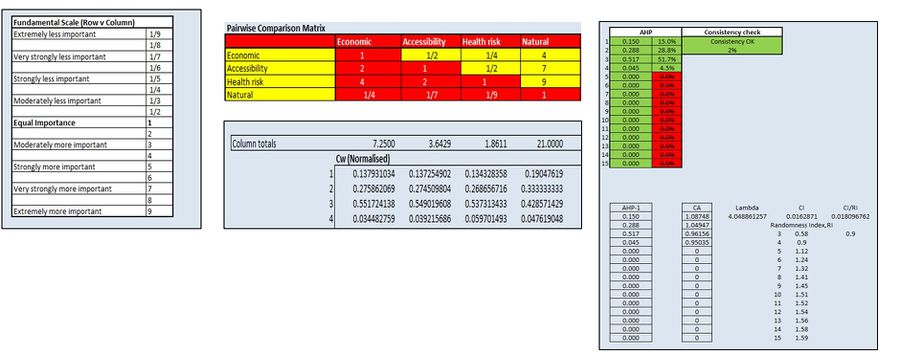
Analytical Hierarchical Process input matrix
This image was extracted from the AHP template created by SCB Associates here: [3]
For the AHP input matrix, the factors are prioritised (in order from highest to lowest priority): Health risk, Accessibility, Economic and Natural Conservation factors. The reason for this order of priority is to ensure first the spread of diseases are constrained and ensure that there is high accessibility, so that key emergency services can be delivered to the quarantined patients in a timely manner. The remaining 2 factors are I think necessary trade-offs.
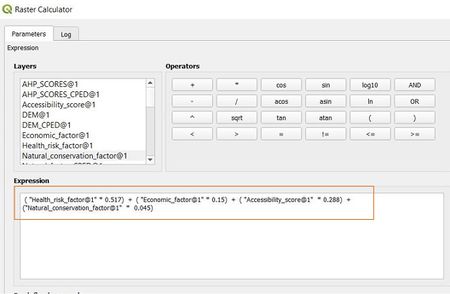
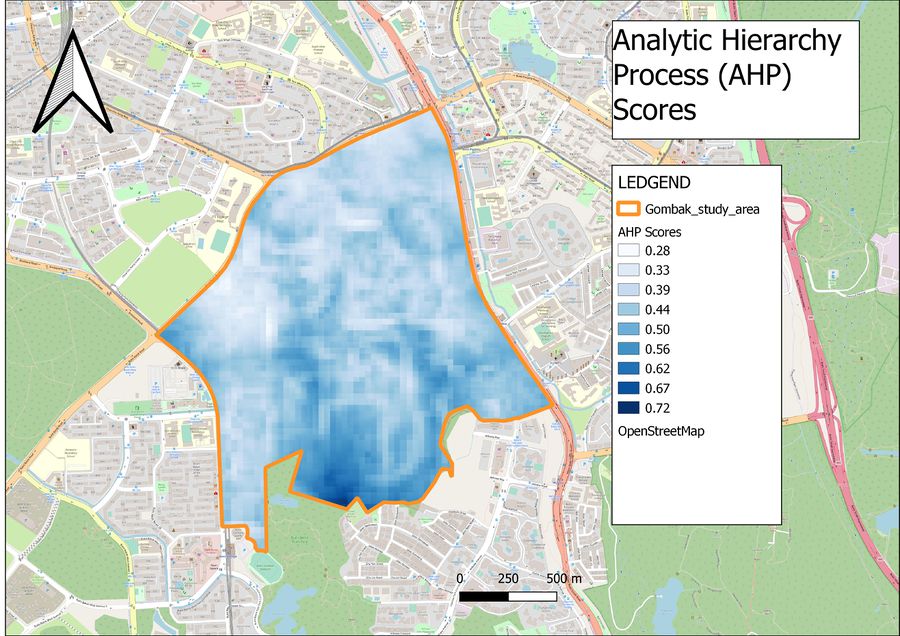
This map is generated with the raster calculator by multiplying each respective standardized criterion score with the weight obtained by the AHP matrix (as shown above).
AHP results report
The result of the AHP matrix scores suggests that the southern area of Bukit Gombak is the most suitable site for the development of a quarantine site (as indicated by the darker color on the map > 0.6). This is because the combined scores as defined by our matrix (for each factor) are highest in that area.
Suitability land lot
Land Lot Suitability Assessment
Land Lot Suitability Assesment
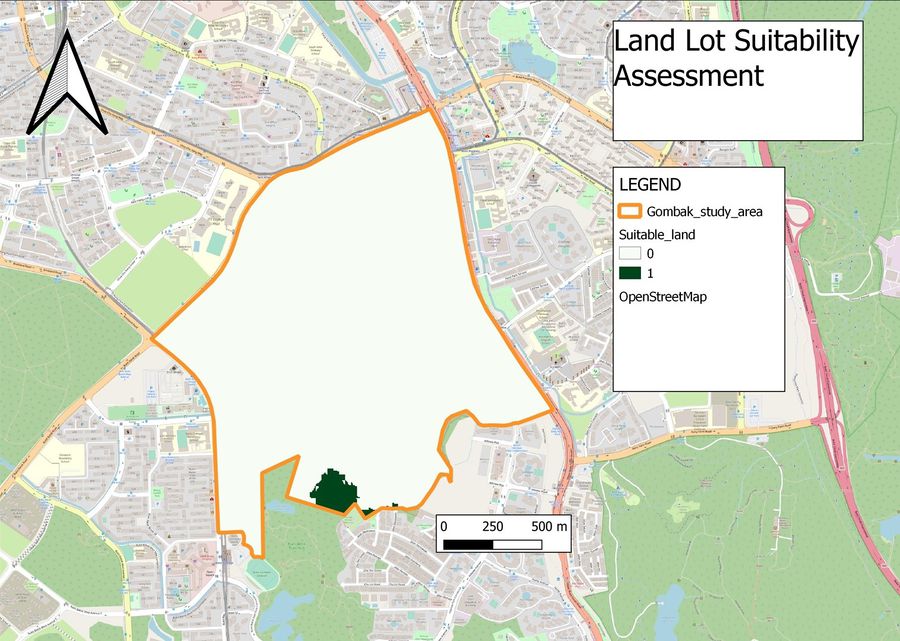
After the initial analysis was done in the previous section, it was found that the upper bound of the AHP scores are within the 0.5 and 0.6 range, hence, I decided to select areas with AHP scores higher than 0.6. This is because if I filter through higher AHP scores, there may be limited sites to fulfill the 10000 m² requirement of land lot suitability assessment.
After the AHP scores are generated and the land lots suitability initial assessment is done, I reclassified the results (by table) by classifying all values between 0 and 0.6 as 0 and all values between 0.6 and 1 as 1. After this is done, only one plot of land in Bukit Gombak remains, which is the southern western part of Bukit Gombak (consistent with the results in the previous section).
Plot of land identified
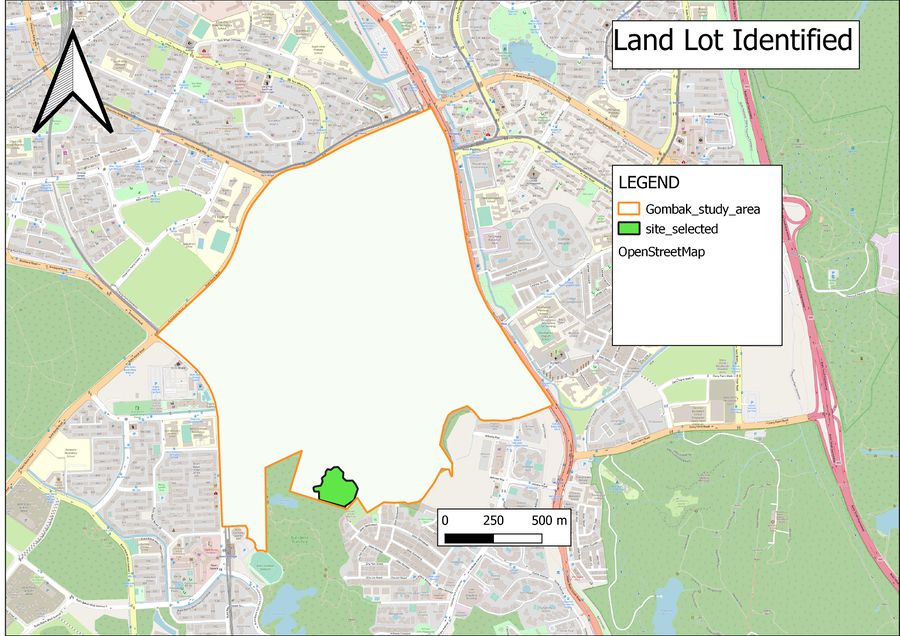
After which, I drew a polygon in the area identified by using the “add new feature” function as a new shape file and drew a polygon in the selected area.
The plot of land identified is 28301.271 m², which also fulfills the 10000 m² minimum contiguous area criterion stated in our task objectives. This is evident from the picture shown below. Hence, this site is selected as the location to build the quarantine center in Bukit Gombak through my analysis.
