SMT201 AY2019-20G1 EX2 Linus Cheng Xin Wei
Contents
- 1 The Task
- 2 Submission Details
- 3 Answers
- 3.1 Part One - Map Views w Roads, Buildings, Natural Areas and Elevation
- 3.2 Part Two - Proximity Raster with Roads, Buildings, Natural Areas and Slope Raster layer
- 3.3 Part Three - Criterion Scores for various Layers
- 3.4 Part Four - Analytical Hierarchical Process input matrix
- 3.5 Part Five - Map layout with the suitability land lot(s)
- 3.6 References
The Task
In this exercise, you are tasked to identify a location suitable for building a national Communicable Disease Quarantine Centre. The selected site must be located at Gombak planning subzone, with a contiguous area of at least 10,000m2 and it must meet the following decision factors:
- Economic factor: The selected site should avoid steep slope. This is because construction at steep slope tends to involve a lot of cut-and-fill and will lend to relatively higher development cost.
- Accessibility factor: The selected site should be close to existing local roads, namely: service roads and tracks. This is to ensure easy transportation of building materials during the construction stage.
- Health risk factor: The selected site should be away from population i.e. housing areas and offices in order to avoid disease spreading to the nearby population.
- Natural conservation factor: The selected site should be away from forested land, park and water.
Submission Details
This is an individual exercise. You are required to work on the take home exercise and prepare submission individually.
Project artefact: All geospatial information compiled and derived, including the QGIS project file and data dictionary. The geospatial and aspatial data must be stored in a single GeoPackage. The project artefact must be uploaded onto eLearn.
Take-home Exercise Report: You are required to edit your take home exercise in the appropriate wiki page of the Take-home Exercise Dropbox. The take home exercise report, beside others, should include all the thematic and choropleth maps prepared and their respective discussion. The title of the wiki page should be in the form of: SMT201_AY2019-20G1_Ex2_FullName.
The report must provide the followings:
- A map layout with four views showing:
- the study area and the target roads,
- the study area and buildings,
- the study area and the target natural features,
- the study area and digital elevation, and
- a short description of not more than 100 words for each view.
- A map layout with four views showing:
- the study area and proximity to target roads layer,
- the study area and proximity to buildings layer,
- the study area and proximity to target natural features layer,
- the study area and slope layer, and
- a short description of not more than 150 words for each view.
- A map layout with four views showing the criterion scores of each factor layers and a short description of not more than 150 words for each view.
- An Analytical Hierarchical Process input matrix and result report and a short description of not more than 150 words discussing the analysis results.
- A map layout with the suitability land lot(s) and a short description of not more than 200 words commenting on each of the suitable land lot identified.
Due Date: 10th November 2019, 11:59PM (mid-night)
Answers
Part One - Map Views w Roads, Buildings, Natural Areas and Elevation
Overview Map
Map View with Roads
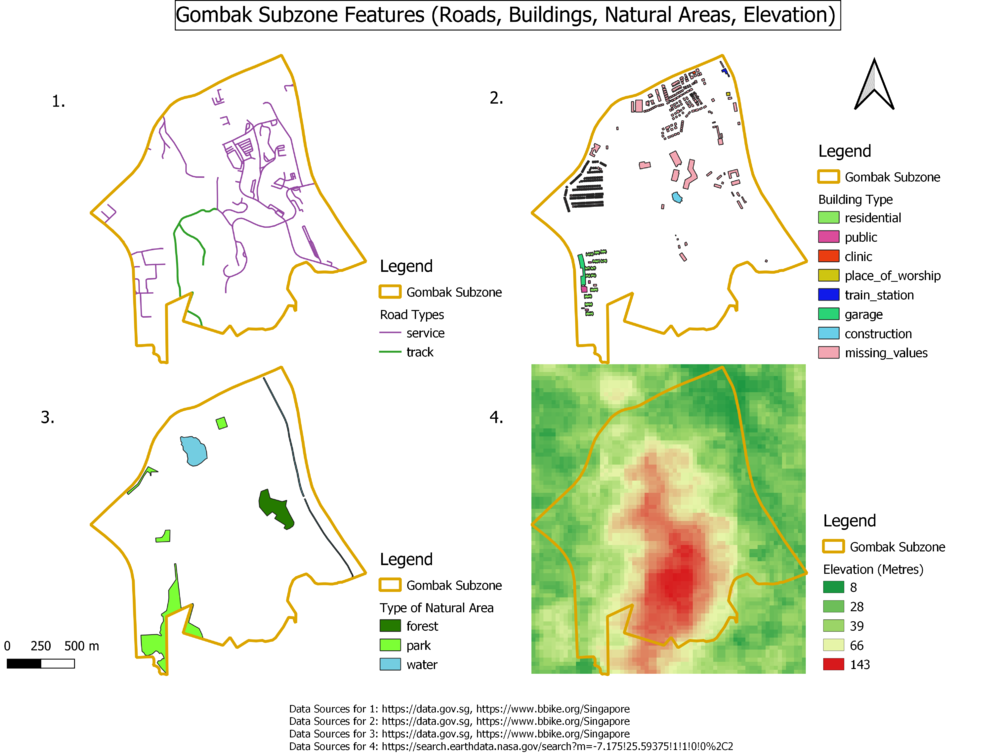
Although there are many types of roads found in the Gombak Subzone, I have filtered and charted the map based on the two target road types for accessibility, service & track. Based on these two types of roads, we have more service type roads as compared to track type roads, as well as a rather sparse road network that does not cover the whole Gombak area.
Map View with Buildings
Buildings are mainly absent from the southern parts of Gombak. Although we can see that most residential buildings are clustered around the west, the other types of buildings are places where the general population gather, including the place_of_worship, and even the construction type. Moreover, there is a huge amount of missing data regarding their building types, denoted by missing_values. In this case, we should take that into account and plan for the worse, where we consider every single building when planning the disease center.
Map View with Natural Areas
There are three types of natural areas found in Gombak, namely forests, parks and water areas . There are not many of these areas, and most of them are located away from the southern part of Gombak, which is what we need to take into consideration for natural conservation.
Raster with Elevation
For the elevation, I used quantile to break up the values into 5 groups. I decided to use a diverging color scheme, as it is easier to compare the values as compared to a sequential colour scheme. Based on 4. , we can see that the highest elevations in the area are gathered around the northern to southern part of Gombak. This is interesting when referencing 2., where we find the majority of buildings located in low elevation areas.
Part Two - Proximity Raster with Roads, Buildings, Natural Areas and Slope Raster layer
Overview Map
Proximity Raster with Roads
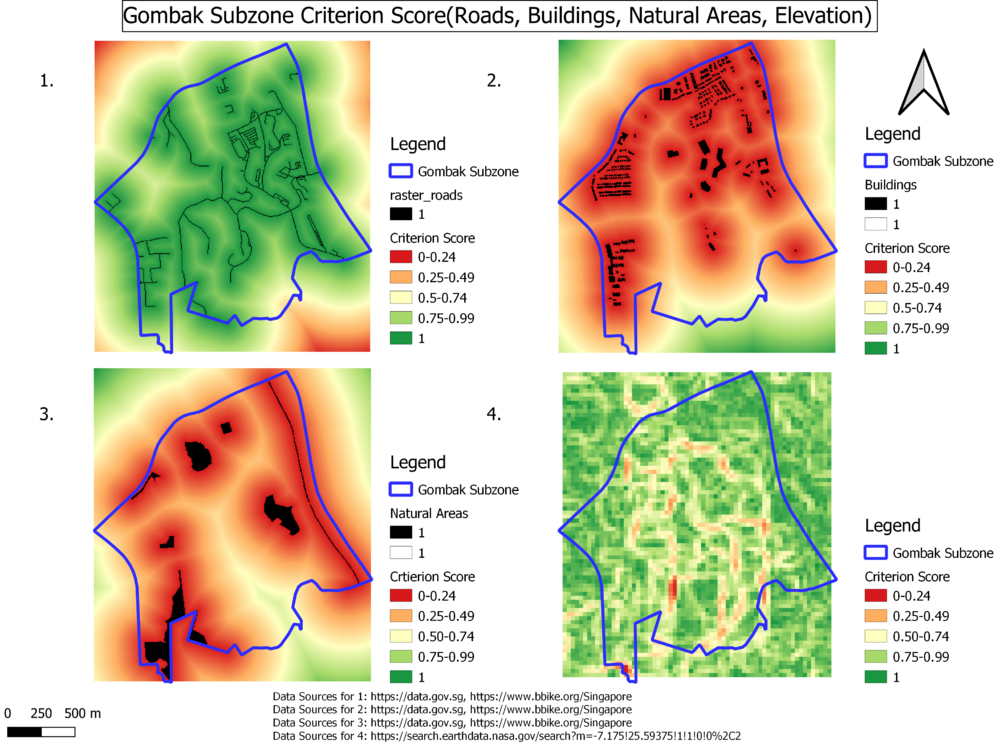
I used a diverging colour scheme of red being undesirable, yellow being the middle ground and green being desirable. The colours are separated by quantile into 5 bins and rounded, with the last bin always being rounded up. In the case of roads, the nearer it is the better for accessibility factor, which is why I flipped the colour scheme around.
Min value = 0, Max value = 722.496 with a resolution of 5 x 5
Proximity Raster with Buildings
I used a diverging colour scheme of red being undesirable, yellow being the middle ground and green being desirable. The colours are separated by quantile into 5 bins and rounded, with the last bin always being rounded up. In case of buildings, the further it is the better for health risk factor, which means the areas that are in green are better than the areas that are in red.
Min value = 0, Max value = 826.62 with a resolution of 5 x 5
Proximity Raster with Natural Areas
I used a diverging colour scheme of red being undesirable, yellow being the middle ground and green being desirable. The colours are separated by quantile into 5 bins and rounded, with the last bin always being rounded up. In case of natural areas, the further it is the better for natural conservation factor, which means the areas that are in green are better than the areas that are in red.
Min value = 0, Max value = 863.669 with a resolution of 5 x 5
Slope Raster Layer
I used a diverging colour scheme of red being undesirable, yellow being the middle ground and green being desirable. The colours are separated by quantile into 5 bins and rounded, with the last bin always being rounded up. In case of steepness of the slope, the less the angle, the better it is for economic factor, which means the areas that are in green are better than the areas that are in red.
Min value = 0, Max value = 36.4308 with a resolution of 5 x 5
Part Three - Criterion Scores for various Layers
Overview Map
Criterion Score for Roads
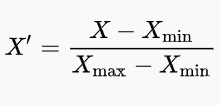
The closer the proximity is to a road, the better it is for accessibility factor. To standardize this value, I employed the above formula to reverse the direction. I used min-max normalization as we can easily get the minimum and maximum value, as well as standardizing the range of values down to [0,1]
Criterion Score for Buildings
The further the proximity is to a building, the better it is for health risk factor. I used min-max normalization as we can easily get the minimum and maximum value, as well as standardizing the range of values down to [0,1]
Criterion Score for Natural Areas
The further the proximity is to a natural area, the better it is for natural conservation factor. I used min-max normalization.
Criterion Score for Slope
The data was the lower the angle of a slope, the better it is for economic factor. To standardize this value, I employed the above formula to reverse the direction. Manipulating the range for the slope is highly important, as the range of values original was out of scale as compared to the other three variables.
Part Four - Analytical Hierarchical Process input matrix
Overview Screenshoot
Explanation
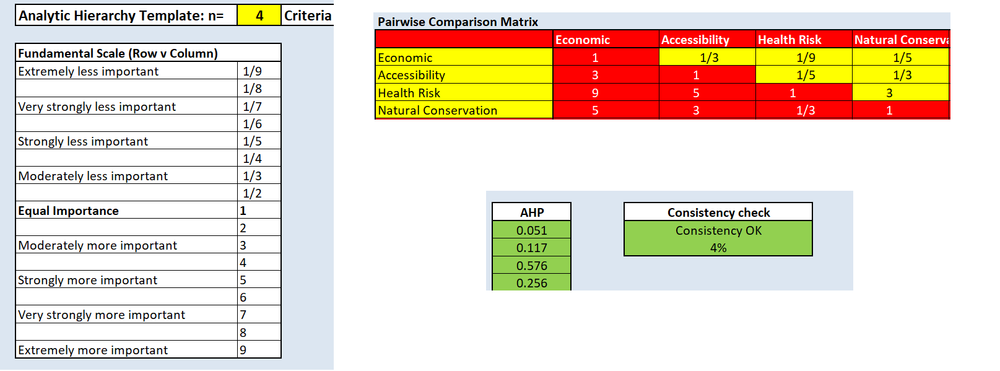
I chose the factors according to this order:
Health risk > Natural conservation > Accessibility > Economic
1. I placed Health risk as the highest factor to take into consideration as the main purpose of the quarantine centre is to prevent and manage the spread of diseases, thus it is critical to place high importance on the prevention of potential contamination.
2. Natural conservation comes next, as the world is facing a crisis of depleting natural areas and resources. Singapore, with NParks, are starting multiple initiatives in order to protect these areas. Compared to a man-made building, natural areas are much harder to come by and form.
3. Accessibility is placed higher than economic factor, as it might lead not only to improved cost through better logistics, but a potentially happier team as they do not have to deal with external factors when building.
The consistency check is less than 10%, at the level 4%, which means the inconsistency is at an acceptable level.
Special thanks to my classmates,
- Kok Su Yee for teaching me how AHP works
- Kelvin Chia, who taught me about the consistency checker.
Part Five - Map layout with the suitability land lot(s)
Overview Map
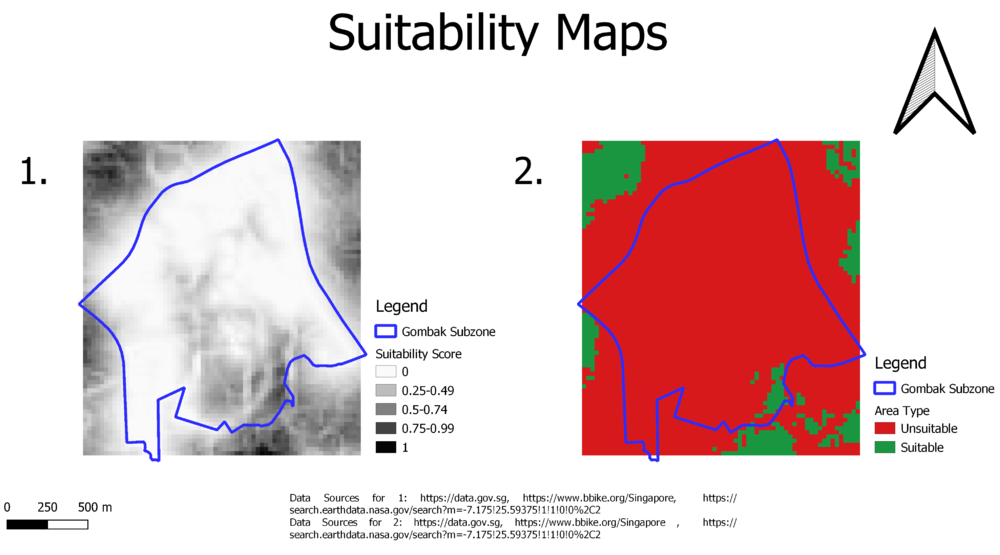
Map 1. is the normalized values times the weights. However, to really find out which areas are the best, I did more filtering by creating Map 2.
Map 2. is a binary classified version of Map 1., with Area Type unsuitable having a suitability score of < 0.49, and Suitable having having a suitability score of >= 0.50
Special thanks to my team mate,
- Eugene Choy for giving me the idea to use binary classification
Calculation * Preprocessing
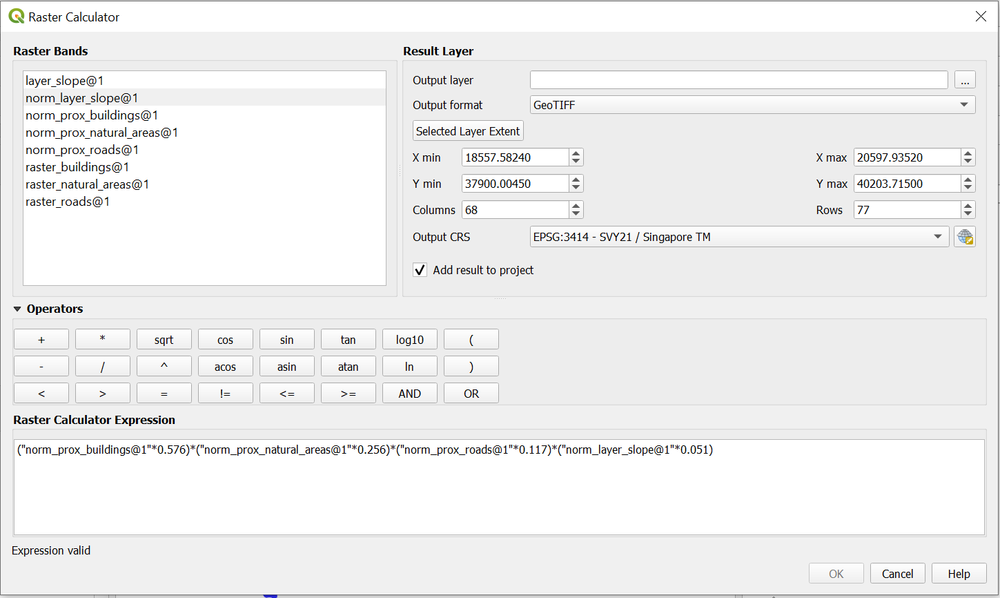
Above is the calculation I used to derive the raster map. I then used min-max normalization on said map just so that I can have nicer values in the end.
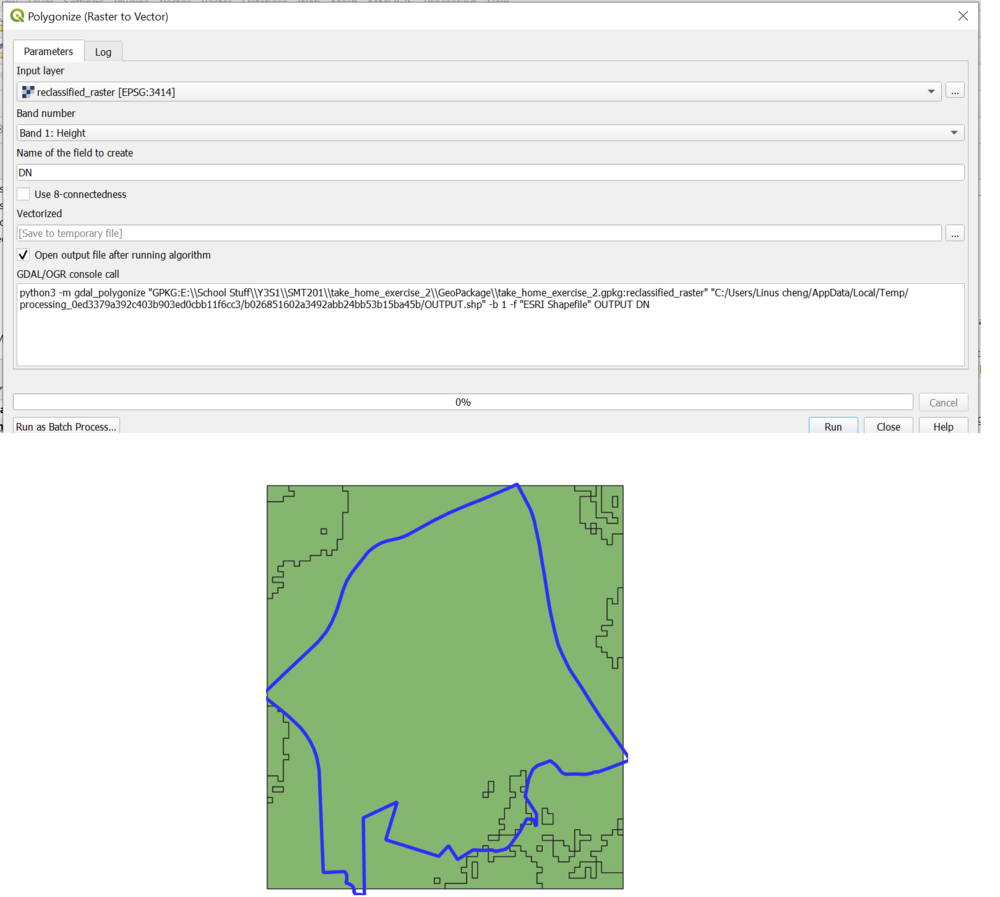
I then vectorized the raster map, in order to be able to get the area of the suitable area types, which results in the map ontop.
We are only interested in the areas inside the Gombak area, so I used the Clip function to retrieve suitable areas there are contained within Gombak.
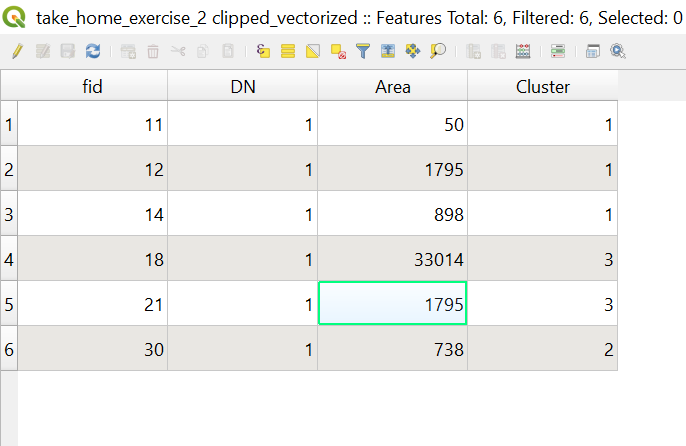
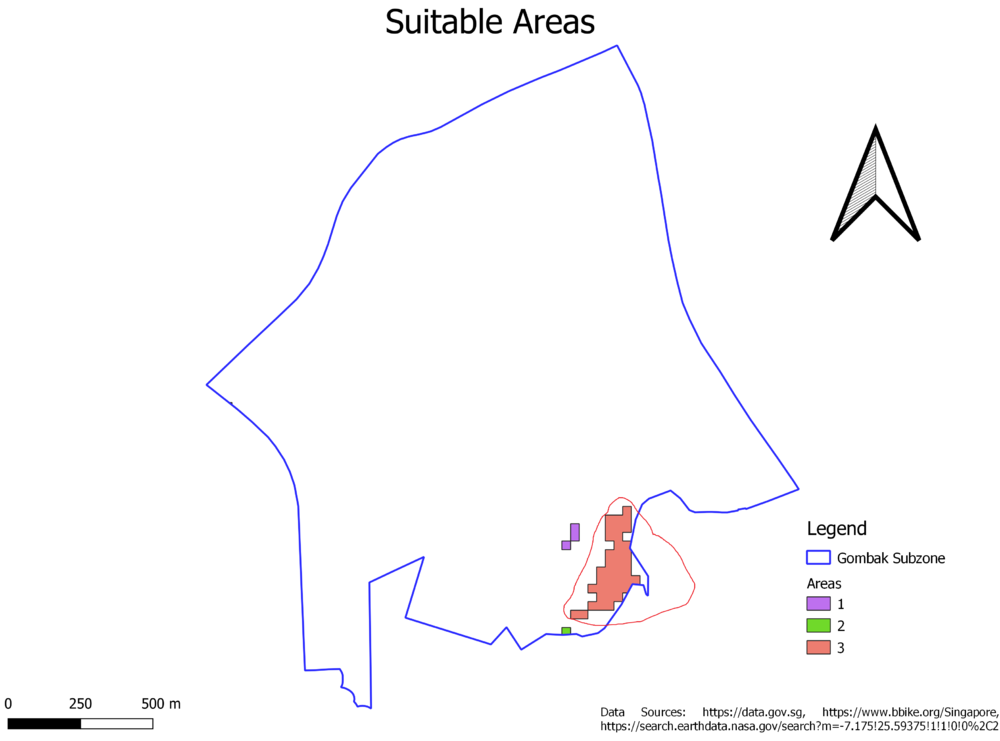
From the clipped results, I manually group the areas into smaller clusters. Here are the final suitable areas calculation, seperated by Cluster.
- Cluster 1 total area: 2734
- Cluster 2 total area: 739
- Cluster 3 total area: 33912
Choice of Area
Based on the calculation above, our final selected and most suitable area is Area 3 (circled in red), as the other two suitable areas do not fulfil the 10000m^2 requirement.
Considering the steps we have taken to arrive at the conclusion, this is the best area as it takes into account economic, accessibility, health risk, natural conservation factors as well as their weight, and has the highest suitability score.
References
- Data Gov Master Plan 2014 Subzone Boundary " Master Plan 2014 Subzone Boundary"
- OpenStreetMap (OSM) Data sets " OpenStreetMap (OSM) Data sets"
- ASTER Global Digital Elevation Model (GDEM) Dataset "ASTER Global Digital Elevation Model (GDEM) Dataset"
- Information about AHP and cosistency score - https://people.revoledu.com/kardi/tutorial/AHP/Consistency.htm
- Information about normalization - https://en.wikipedia.org/wiki/Normalization_(statistics)
- Information about conservation management - https://www.sciencedirect.com/topics/earth-and-planetary-sciences/conservation-management
- Information about conservation efforts in Singapore - https://www.straitstimes.com/singapore/urgent-call-for-spore-to-help-safeguard-regions-biodiversity
