SMT201 AY2019-20G1 EX2 Lim Shi Xian Alvin
Contents
Objective
The objective of this activity is to locate a suitable area to house the National Communicable Disease Centre. There are three criteria which the area would be subjected to. They are:
- Economic Factor
- Accessibility Factor
- Health Risk Factor
- Natural conservation factor
Inital Evaluation
Accessibility Factor: Roads
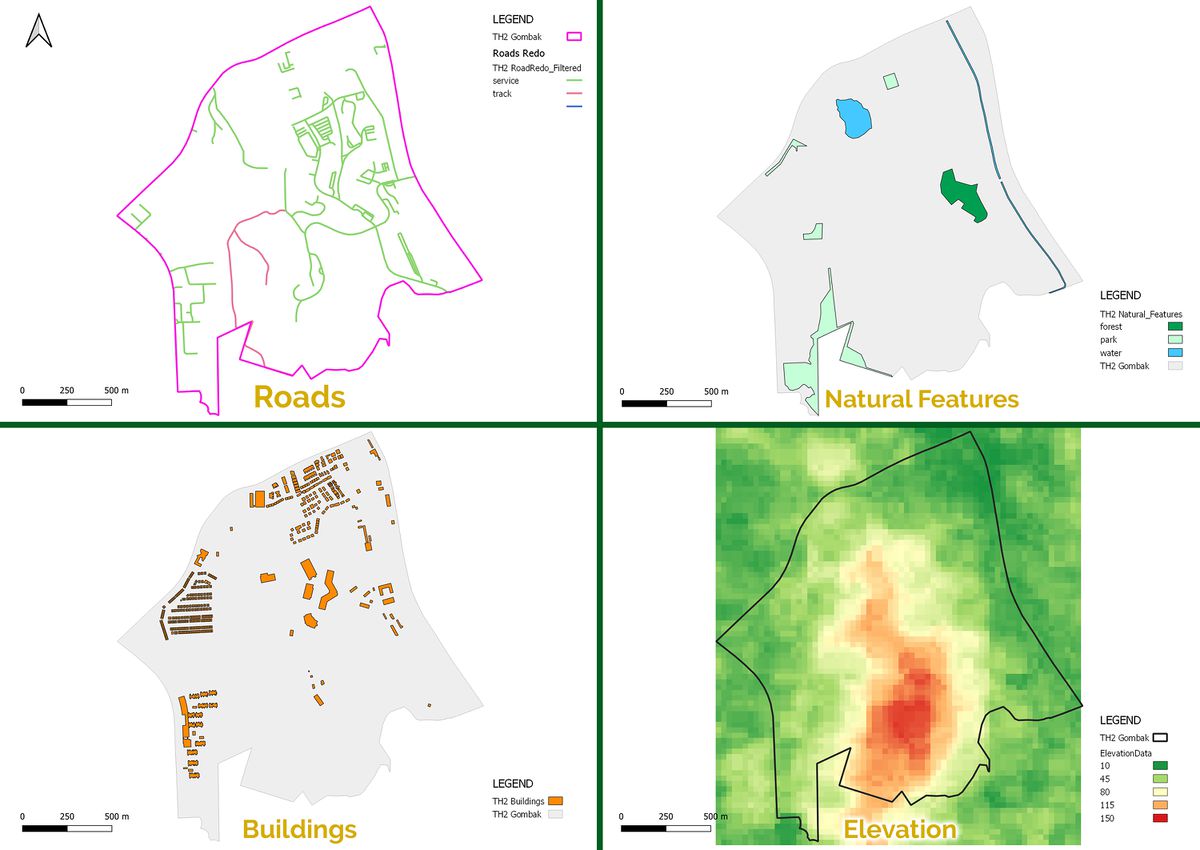
The main two types of roads that we will be looking at are service and tracks. Upon closer scrutiny, 199 roads are labelled as “service”, and only two of them are “tracks”. The “service” roads are symbolized in green and the “track” roads are symbolized in deep pink. Roads facilitates transportation, which is important for both pre (transportation of sediments for construction) and post construction (Transportation of Workers). It could be observed that majority of the roads are concentrated on the North-East area of Gombak.
Natural Conservation Factor: Natural Features
Another requirement for a suitable plot of land for the construction of the National Communicable Disease Quarantine Centre is its distance from natural features. There are eight features that are identified which are natural features, three of which is water bodies, four of them are parks and one of them is a forest. The water is symbolized as a cyan-esque feature, the parks are light green and the forest takes on a darker shade of green.
Health Risk Factor: Buildings
As the name “Communicable Disease” implies, having the NCDQC near buildings will spark a significantly outcry amongst the community, while potentially endangering them. The attribute table of this layer revealed the nature of some of these buildings. Some of them were clinics, some were residential or places of worship. However, a staggering amount of them (505 to be exact) are unclassified. Therefore, I’ve decided not to classify them by their purpose as that would yield a significant number of unknowns and would not be helpful in the overall objective of this undertaking.
Economic Factor: Elevation
Elevation plays an important role of determining the cost of the construction. Steep slopes would require more landfill as compared to gentle ones. As landfills are a generally expensive method to level the ground, avoiding such a procedure would bring the cost of construction down. As depicted from the image above, the South region of Gombak is pretty elevated, maxing out at almost 150m above sea level while the surroundings of Gombak are generally pretty flat.
Proximity Analysis
Accessibility Score: Roads
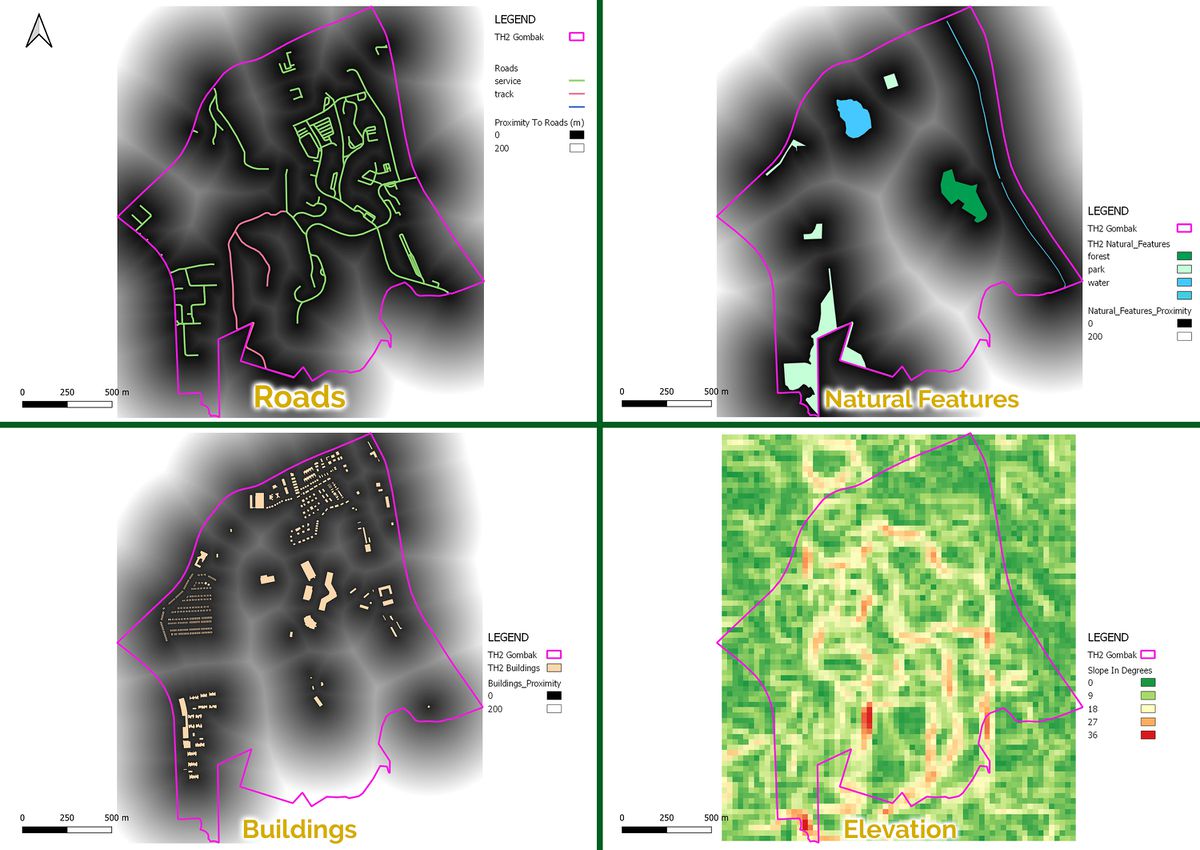
The darker the shades of grey, the closer the spot is to the roads. Darker shades of grey would therefore indicate better accessibility and would be more suitable for the construction of the facility, especially during pre-construction where large amount of materials must be delivered to the site for construction and accessibility impacts the speed of this process.
Natural Conservation Score: Natural Features
The darker the shades of grey, the further the spot is to the natural features. As distance is now considered a boon, the standardized scores do not need to be inverted for this criterion.
Health Risk Score: Buildings
Similarly, the darker the shades of grey, the further the spot is to the buildings. Distance here is also a boon and therefore the standardized scores can be used natively during the amalgamation process.
Economic Score: Elevation
Steeper slopes are considered a bane to the construction of the facility. Natively, the score favours larger elevation, therefore the score is inverted using the “1 – Standardized Results of Proximity to Features” formula. Greener shades indicate gentler slopes which are more suitable for construction and redder ones indicate the opposite.
Criterion Scoring
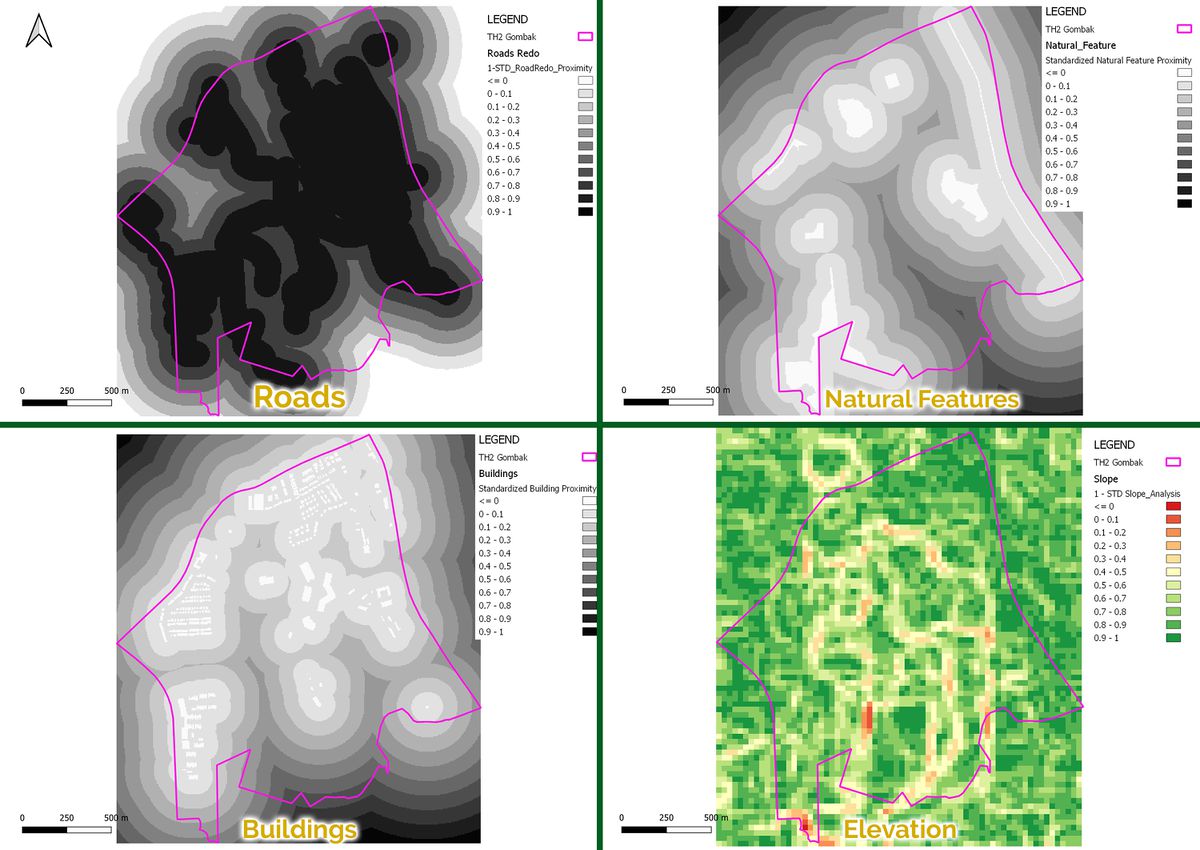
In order to obtain the plot of land which is most suitable for the construction of the NCDQC, the scores must be weighted, and the layers amalgamated. However, before doing so, the scores must be standardized to ensure larger figures do not skew the criterion. But first, we have to first determine what is considered desirable and what is not. In this respect, I must ensure that a higher score is assigned when an aspect is more favourable for the building’s construction. For example, the default values for road is such where a larger “score” is assigned when a point is further away from the road. This is because the units are in distance. However, we favour areas which are closer to the road, and weighting this directly would mean that we favour the opposite. Therefore, we must invert the scores.
Standardization is done using the following formula: [Proximity to Features - Min(Proximity to Features)] / [Max(Proximity to Features) - Min(Proximity to Features)]
The scores for “Roads” and “Slope” are inverted using the formula for correct criterion scoring: 1 – Standardized Results of Proximity to Features
Accessibility Score: Roads
The darker the shades of grey, the closer the spot is to the roads. Darker shades of grey would therefore indicate better accessibility and would be more suitable for the construction of the facility, especially during pre-construction where large amount of materials must be delivered to the site for construction and accessibility impacts the speed of this process.
Natural Conservation Score: Natural Features
The darker the shades of grey, the further the spot is to the natural features. As distance is now considered a boon, the standardized scores do not need to be inverted for this criterion.
Health Risk Score: Buildings
Similarly, the darker the shades of grey, the further the spot is to the buildings. Distance here is also a boon and therefore the standardized scores can be used natively during the amalgamation process.
Economic Score: Elevation
Steeper slopes are considered a bane to the construction of the facility. Natively, the score favours larger elevation, therefore the score is inverted using the “1 – Standardized Results of Proximity to Features” formula. Greener shades indicate gentler slopes which are more suitable for construction and redder ones indicate the opposite.
Analytical Hierarchical Process (AHP) Input Matrix Cum Result Report
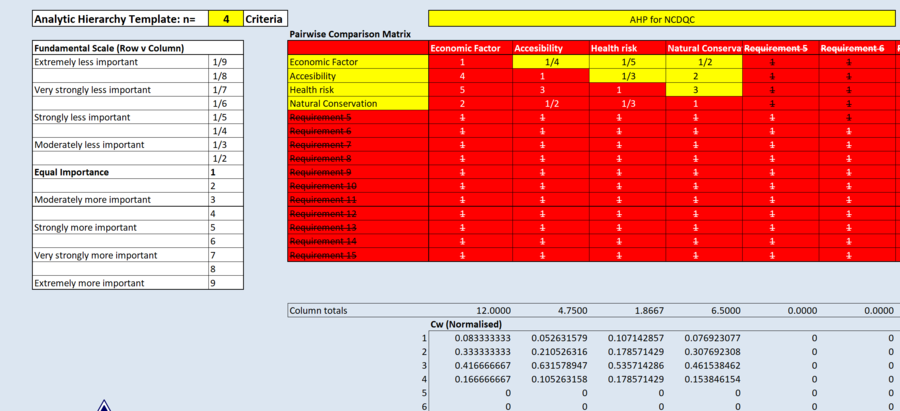
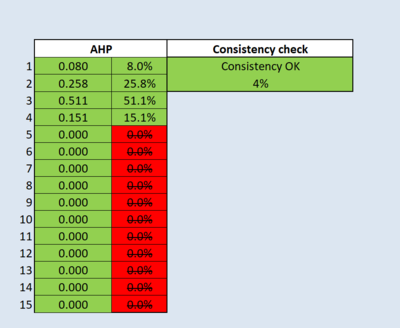
The use of AHP allows us to weigh each factor against another to derive a given weight when a user provides a set of inputs. In this case, as seen from the first row Pairwise Comparison Matrix, I’ve decided that Accessibility is quite a bit more important than Economic Factors, Health risk being significantly more and Natural Conservation being slightly more.
What entails is a set of values that are generated which will be later used for the amalgamation process. As such, we can see that Economic factor has a very low weightage, Accessibility and Natural Conservation retaining rather modest values and Health Risk being the most significant factor here. The low consistency index of 0.04 indicates that the values I’ve used is valid, and we could now proceed to the next step.
Suitable Land Lots
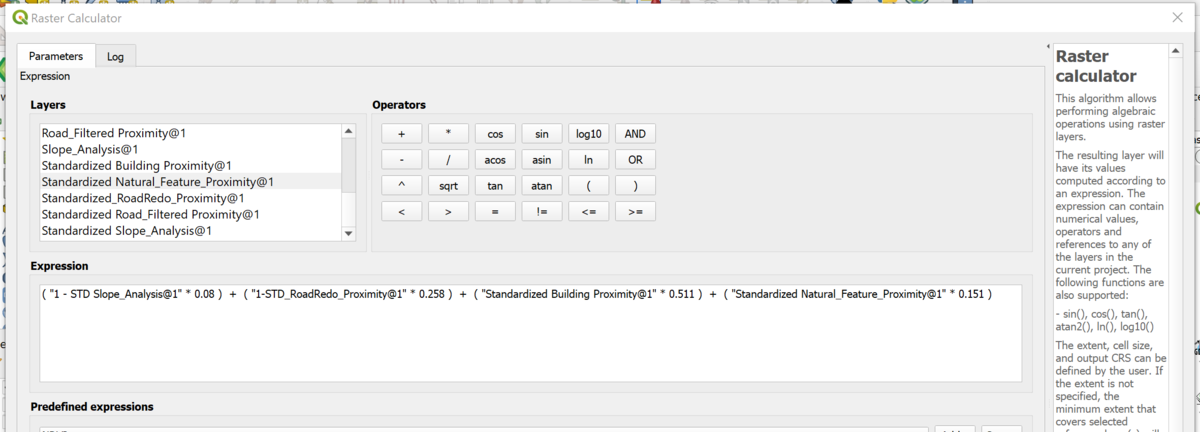
After using the following formula shown above to amalgamate the four layers, the following layer was derived:
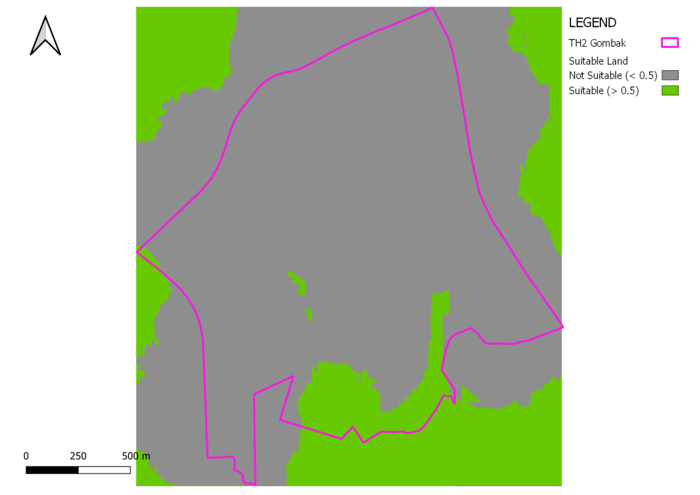
Essentially, the larger the number, the higher the suitability for the construction of NCDQC. The greener shades represent a larger number and therefore is more suitable as compared to the ones which are redder, which represents a smaller number.
I’ve decided to set a threshold of 0.5, where anything above this number is considered suitable and vice-versa.
The suitable regions are concentrated around the South region of Gombak, as evident from the green shades. There are small pockets of suitable land besides the significant ones at the bottom but they are too small to meet the basic requirement of having a contiguous area of 10,000m^2.
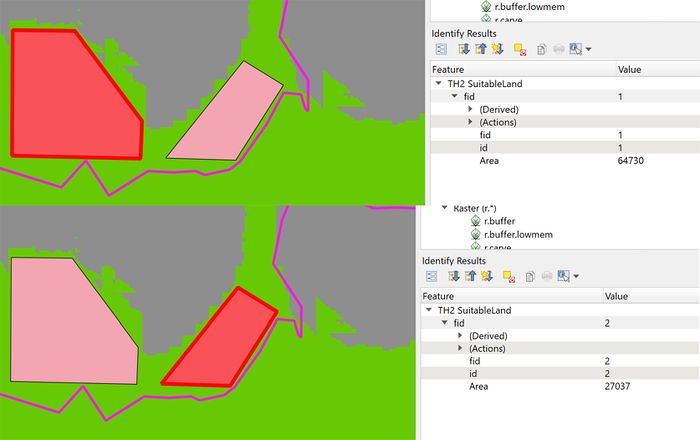
From the available space at the bottom, two plots of lands were identified that are suitable for the construction. The first plot of land has a contiguous area of 64730m^2 and the second, 27037m^2. The values were derived from adding a field into the attribute table using the $area function to obtain it.
