SMT201 AY2019-20G1 EX2 Kelvin Chia Sen Wei
Contents
- 1 Q1. Study Area and its features
- 2 Q2. Study Area and its features proximity
- 3 Q3. A map layout with four views showing the criterion scores of each factor layers
- 4 Q4. Analytical Hierarchical Process input matrix and result report
- 5 Q5. A map layout with the suitability land lot(s)
- 6 Appendix A: Example on standardising and applying of criterion score to the proximity raster layer
- 7 Appendix B: Example on merging all the factor layers with weights
Q1. Study Area and its features
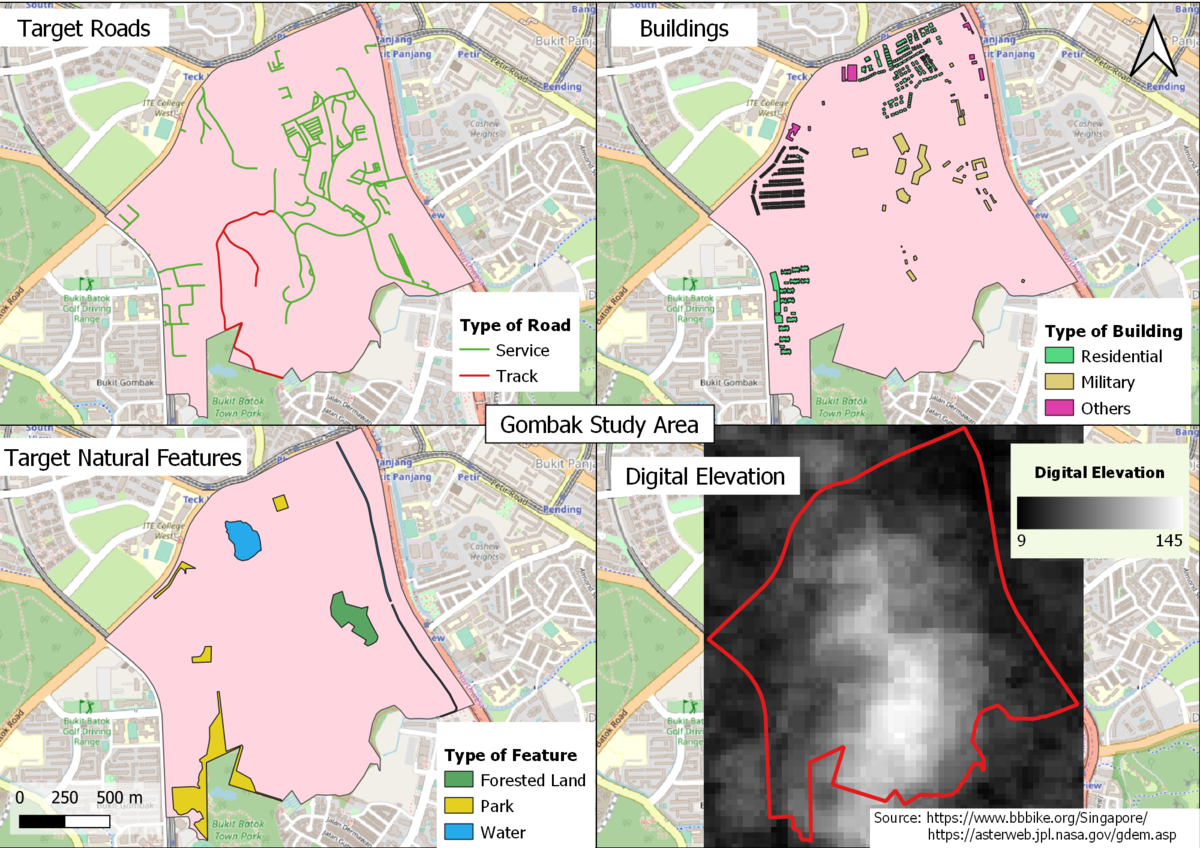
There is a denser network of service and track roads on the eastern side of Gombak. Hence, the eastern area can be prioritized as it ensures easy transportation of building materials during the construction stage.
Residential buildings are mainly concentrated at the northern and western side and we should avoid these areas when building the CDQC to avoid disease spreading to the nearby population. The southern area can be considered as it is mainly a military area and is away from away from the population.
As the selected site should be away from forested land, park and water, the southern part of Gombak would be the ideal area.
Q2. Study Area and its features proximity
Q3. A map layout with four views showing the criterion scores of each factor layers
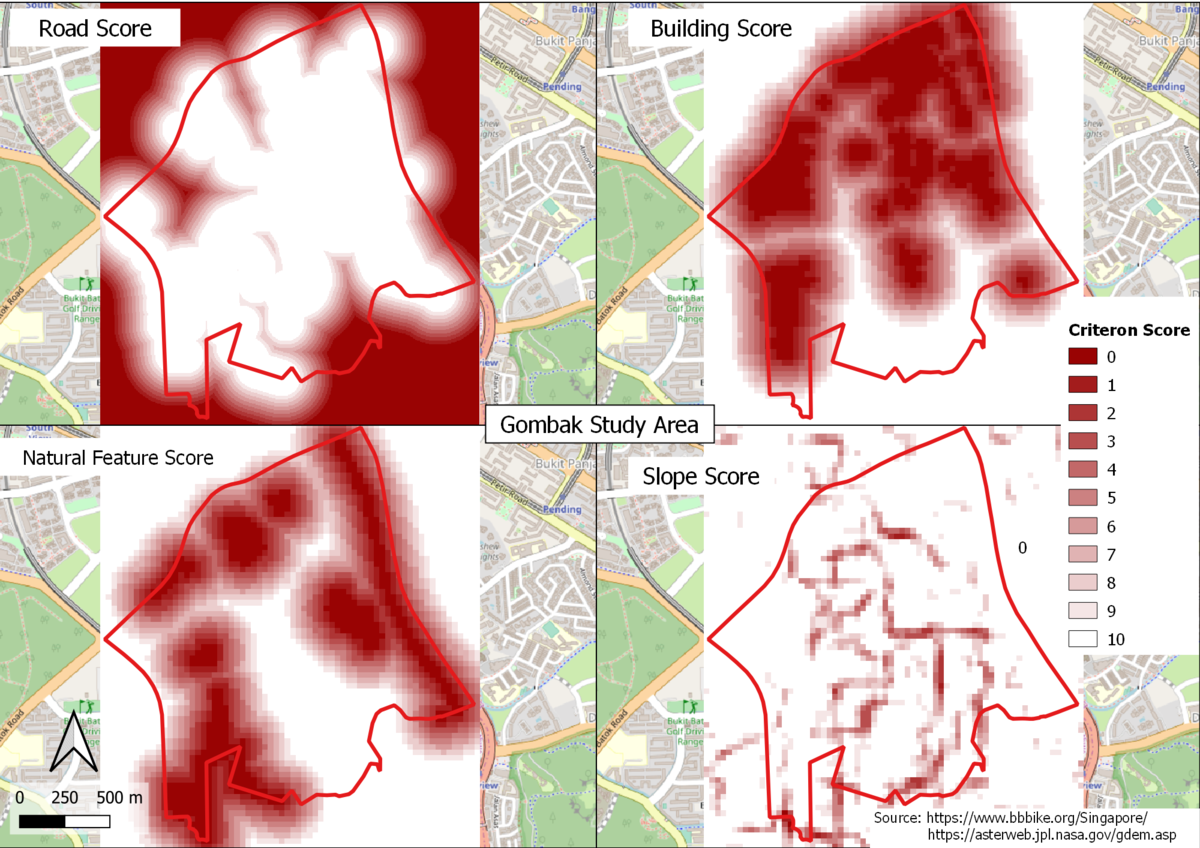
Each factor have been standardised with 0 to 10 range, with the below metrics used to derive with the criterion scores:
Building Criterion Metric: Areas further than 250m from any building will attain 10 points, decrements 1 point for every 25m nearer to any building.
Target Roads Criterion Metric: Areas nearer than 100m to any service/track roads will attain 10 points, decrements 1 point for every 20m further from any service/track roads.
Target Natural Features Criterion Metric: Areas further than 250m from any natural features will attain 10 points, decrements 1 point for every 25m nearer to any natural features.
Slope Criterion Metric: Areas with slope steepness less than 15 degree will attain 10 points, decrements 1 point for every 2 degree increase in slope steepness.
Note: Higher score is better
Q4. Analytical Hierarchical Process input matrix and result report
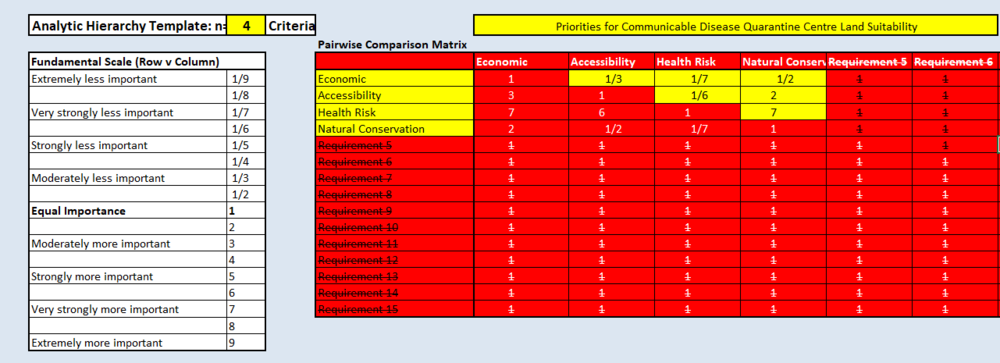
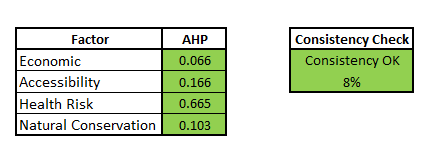
From the above results, health risk poses as the most critical factor and economic factor being the least weighted factor in determining the suitable location for CDQC.
The consistency check is below 10% and the inconsistency is acceptable.
Reference: https://people.revoledu.com/kardi/tutorial/AHP/Consistency.htm
Q5. A map layout with the suitability land lot(s)
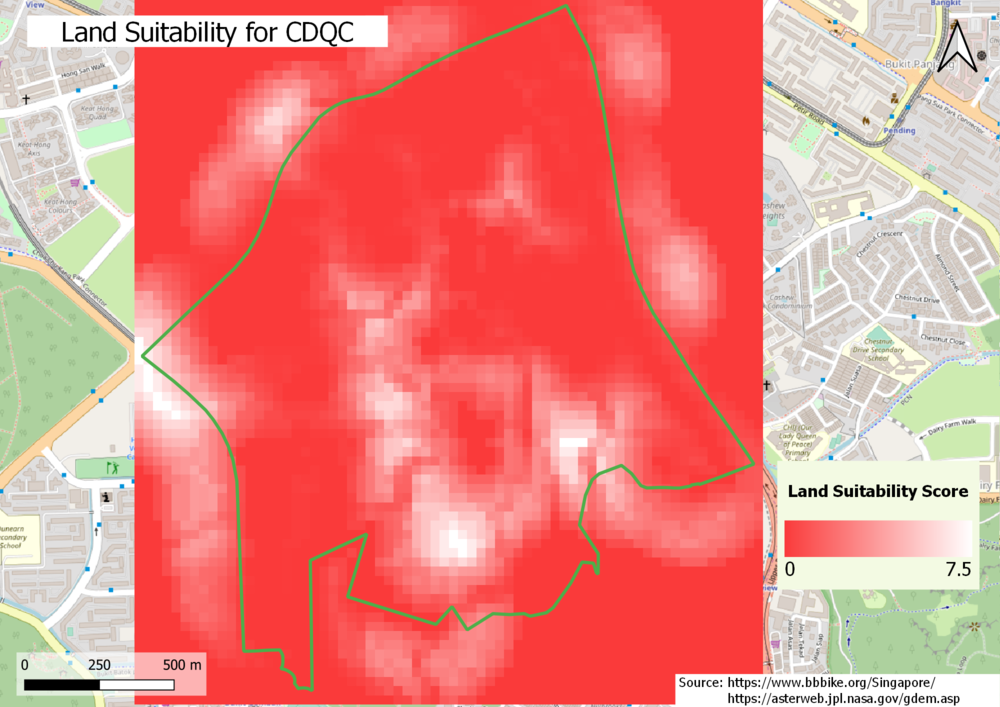
The factor layers created in Q3 have been merged with the weights produced in Q4. Kindly refer to appendix for the guide. The whiter areas are suitable land areas.
Note: Higher score is better
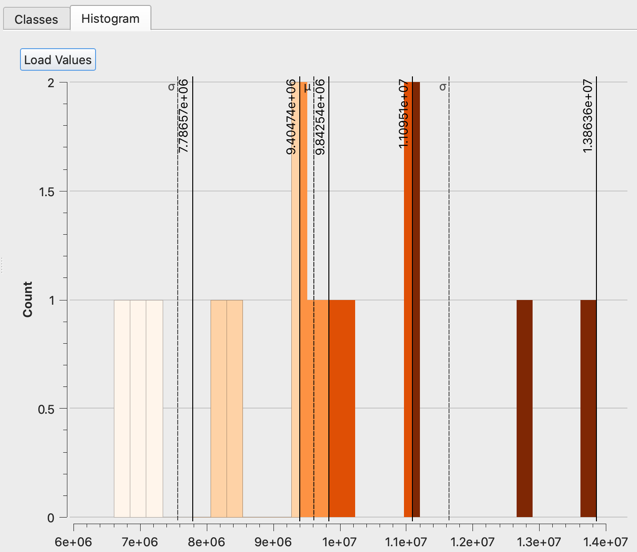
Below is the selected land areas with a contiguous area of at least 10,000m2 and meeting all the decision factors derived in Q3.
Land Area:
Location A: 10,902 m2
Location B: 11,660 m2
Location C: 13,357 m2
Location B is the most suitable area to build the CDQC due to its rectangular form as compared to Location C and whiter areas as compared to Location A.
Appendix A: Example on standardising and applying of criterion score to the proximity raster layer
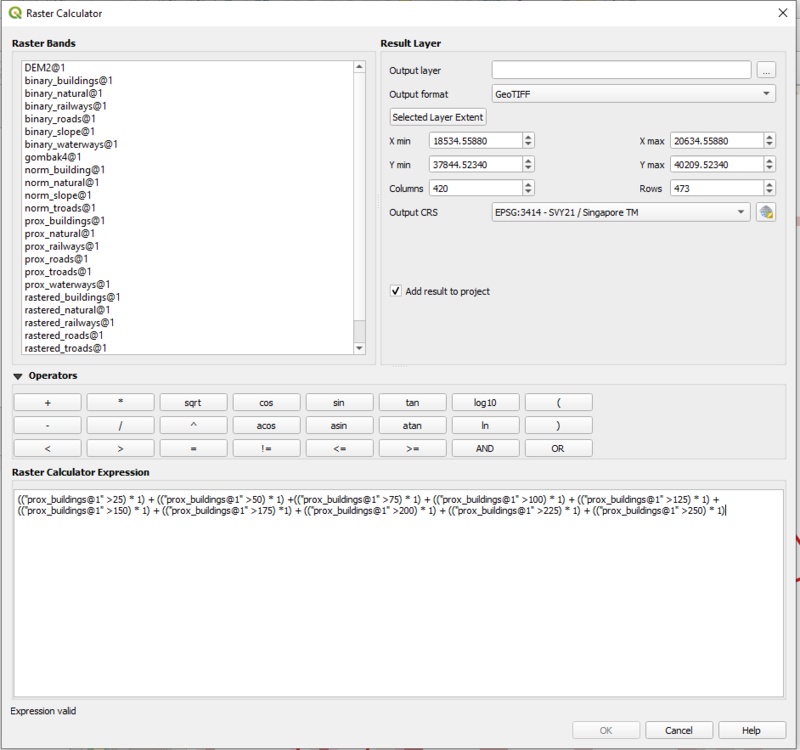
Through the Raster Calculator, the range of values that I want for the output is 0 to 10 and the following condition has been set for the building proximity:
Areas further than 250m from any building will attain 10 points, decrements 1 point for every 25m nearer to any building.
The reason for setting the criterion is to allow for a proper evaluation whereby only an area will be strongly considered when it is 250m away from any building. Through the standardisation, it will allow for fair comparison with other layers to derive with the suitable location.
Appendix B: Example on merging all the factor layers with weights
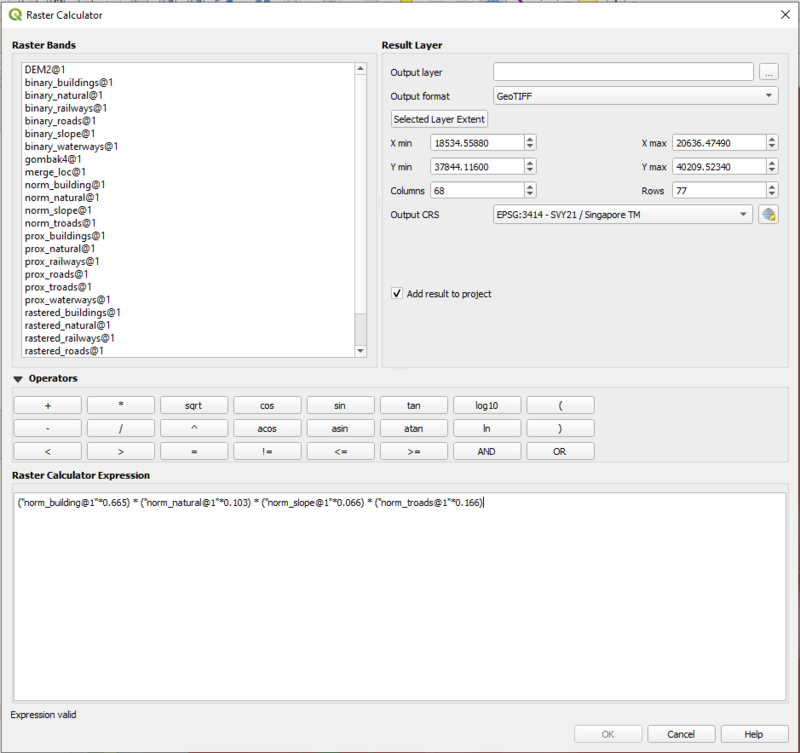
Through the Raster Calculator, the below calculation merges each factor layers with the weights produced by AHP to provide with the combined raster layer determining the suitable locations.
