SMT201 AY2019-20G1 EX1 Nigel Poon Wei Chun
Contents
Thematic Mapping
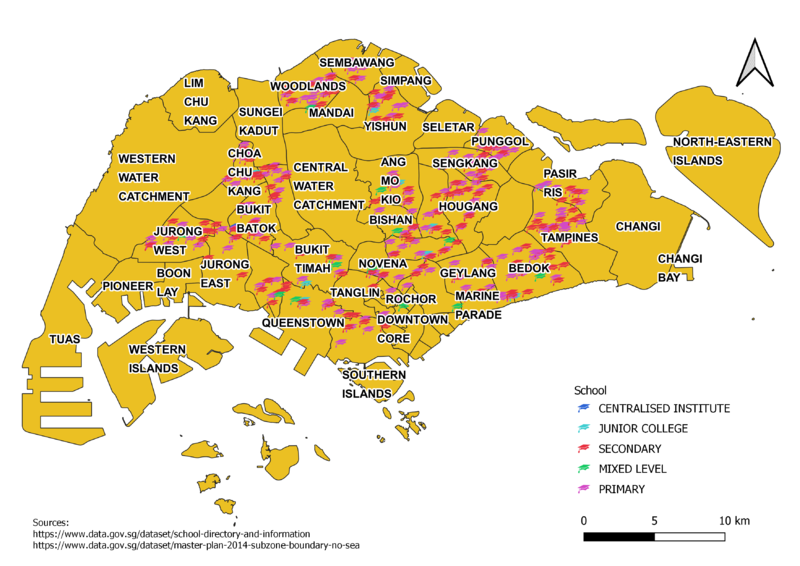
Level of Schools
This map shows the distribution of schools in Singapore. The Geographical locations were derived using the ONE MAP API. The Schools fall under 5 categories with different colours and symbolized by the education SVG marker. Primary and secondary schools dominate as the majority of schools in Singapore.
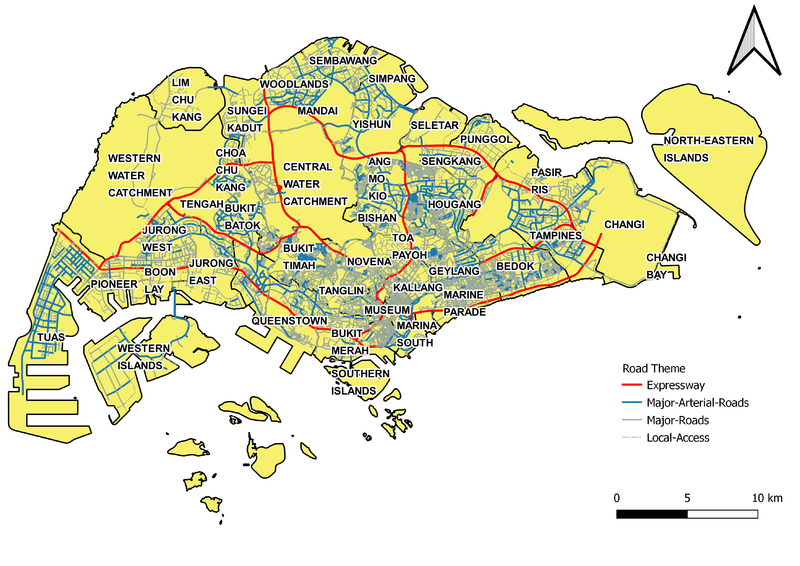
Road Hierarchy Map
This map shows the road hierarchy of Singapore according to LTA standards (https://www.ura.gov.sg/-/media/Corporate/Resources/Publications/Streets-and-Building-Names/SBNB_handbook_streets.pdf?la=en)
The 4 categories have been coloured to differentiate between each other as well as different widths to showcase the hierarchy. With the exception of Major roads being a grey solid line and local access roads as a grey dotted line.
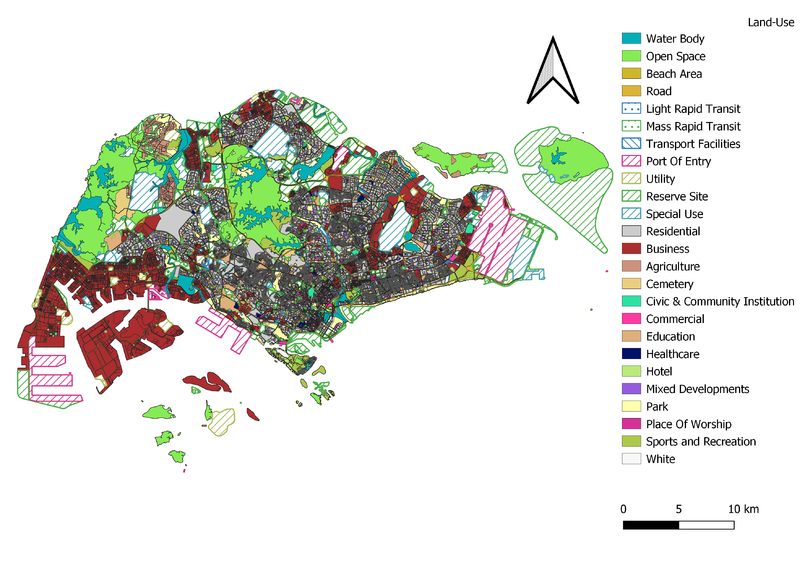
Master Plan Land use
The Data has been grouped to themes which I felt would be useful to analyse as a whole like the business 1 and business 2 being grouped to one theme.
The various patterns are present to paint a better visualizing to prevent overcrowding with too many colour which transition to look the same when projecting.
The colours like waterbody and open space have been tuned to look more in align with the natural state.
Various patterns can be seen such as
- Port of entry being built at the bottom-right area and top left area of Singapore
- Reserve areas being located at the North and North-East
Choropleth Mapping
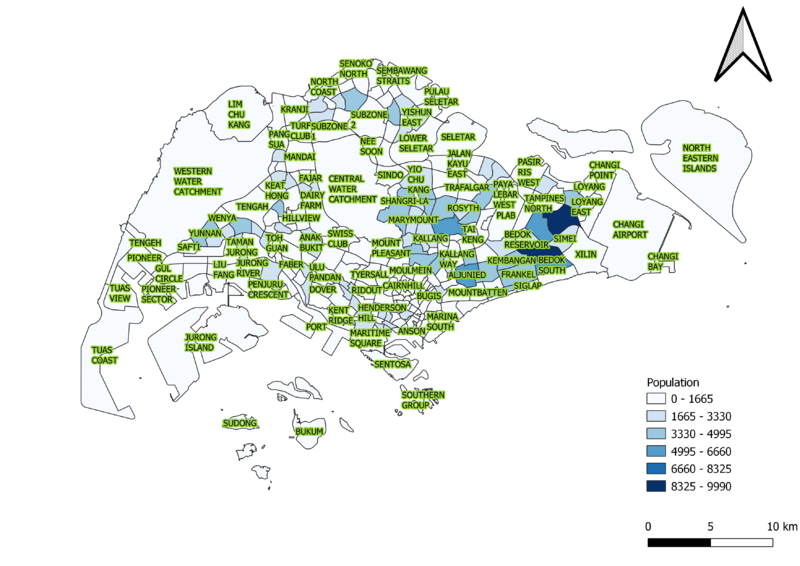
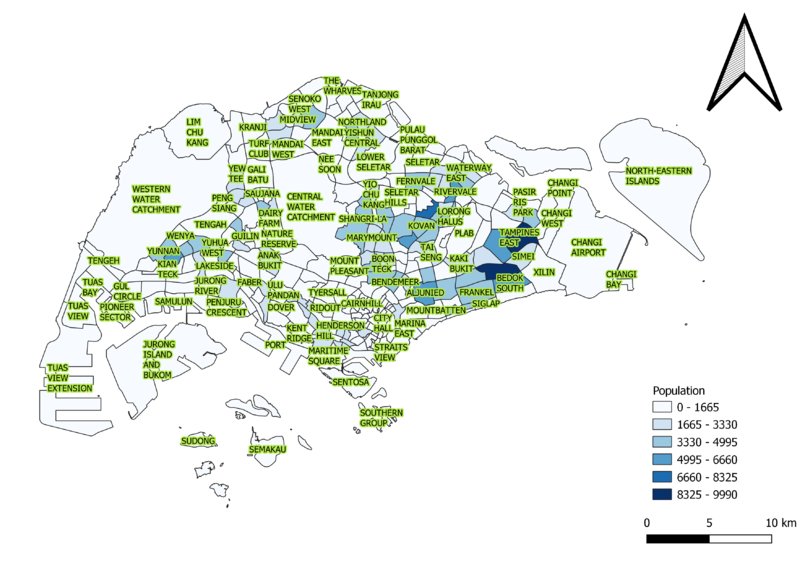
Population Aged 65+
2010
2018
The maps were connected differently 2018 data to 2014 masterplan shapefile, 2010 data to 2008 shapefile. This is to ensure that the data would correspond accurately to the polygons
Major of the elderly live in the Tampines, Bedok, Serangoon, Toa payoh and Thomson as well as the neighbourhood around these highlighted areas.
In the bigger picture through the years. the elderly population as slightly increased and this very apparent in Kian Teck
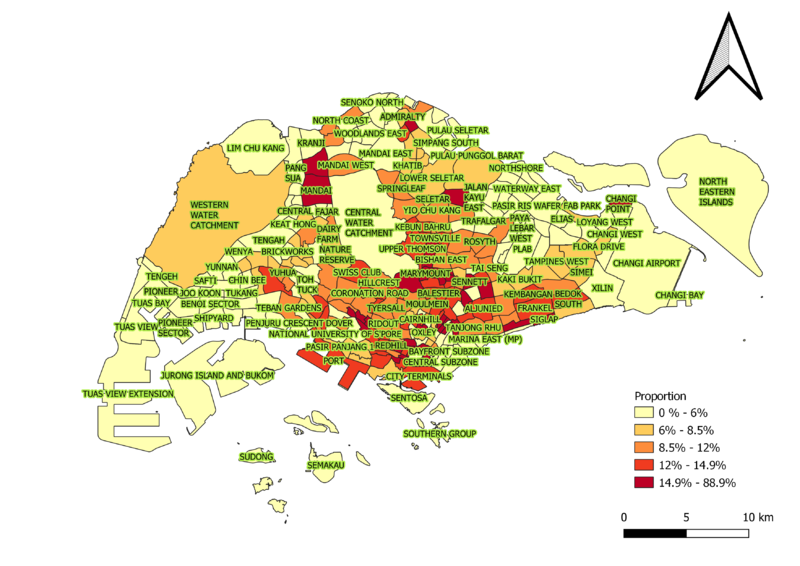
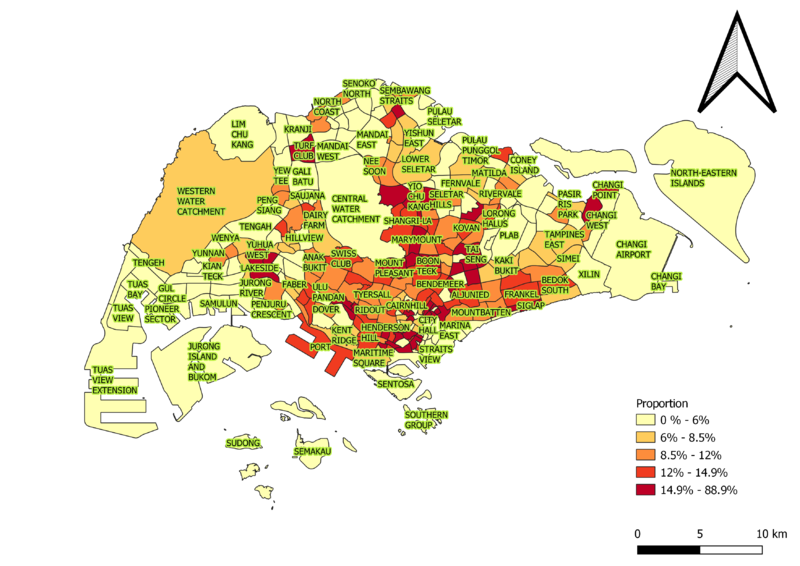
Proportion Aged 65+
2010
2018
The maps were connected differently 2018 data to 2014 masterplan shapefile, 2010 data to 2008 shapefile. This is to ensure that the data would correspond accurately to the polygons
A large number of subzones are becoming matured estates.
This trend is very visible in the subzones near Yio Chu Kang and Clementi proximity
Percentage Change between 2010 and 2018
Both 2010 and 2018 data were connected to the 2014 masterplan shapefile to show differences. With an extra background layer which accounts for missing data or new subzones which have been drafted
As a whole Singapore is having a large amount of its subzone becoming matured estates with little replacement of younger residents .
Sembawang East is currently facing the fastest change of its population.
