SMT201 AY2018-19T1 EX2 Lim Jia Yang James
Contents
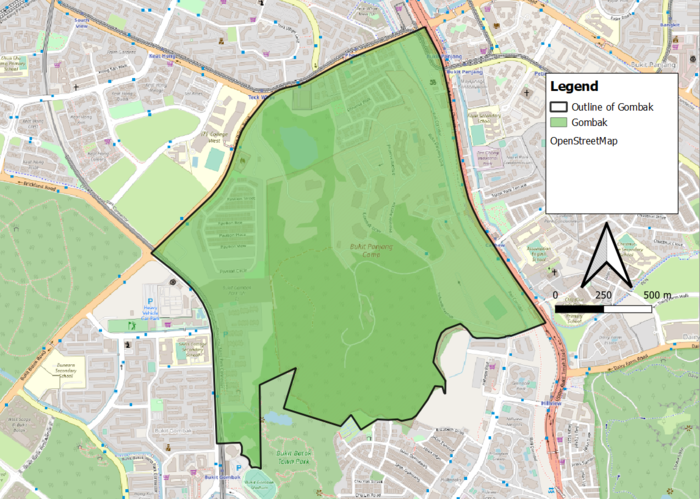
Gombak National Communicable Disease Quarantine Centre
The task was as such- a National Communicable Disease Quarantine Centre had to be constructed in planning subzone Gombak. The contagious area is at least 10,000m2 and it also had to adhere to the following decision factors:
- Accessibility factor: The selected site should be close to existing service roads and tracks.
- Health risk factor: The selected site should be away from population.
- Natural conservation factor: The selected site should be away from forested land, park and water.
- Economic factor: The selected site should avoid steep slope.
Accessibility Factor (Roads)
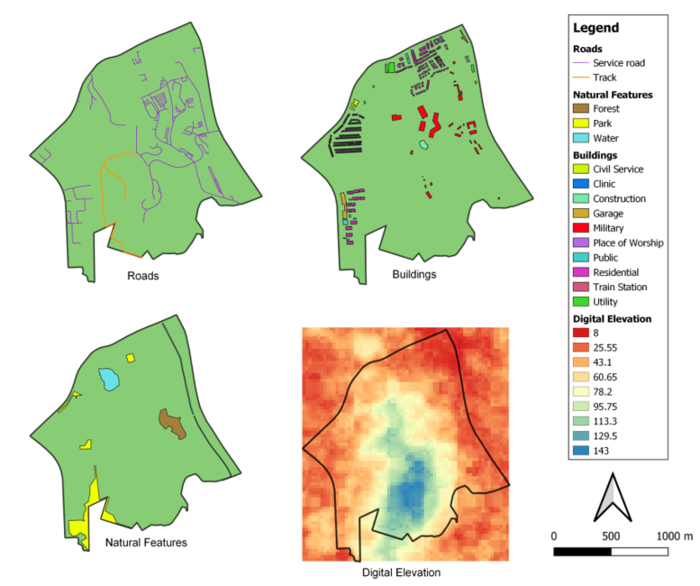
Construction of a National Communicable Disease Quarantine Centre requires a copious amount of construction materials; hence convenient delivery of these materials to the site is essential. Of all the various paths of travel available, only tracks and service roads have been identified as those of use, of which there are 2 and 186 respectively. Tracks are identified in orange and its lines made thicker than service roads, with the purpose of further differentiating itself. It is keen to note that transport to the north-east regions of Gombak will be done mostly by service roads whereas tracks connects to the south-east region.
Health Risk Factor (Buildings)
As we are constructing a communicable disease centre, it is crucial to ensure that the selected site should be away from high human density places in order to avoid disease spreading to nearby population. With the data from OpenStreetMap, there were many buildings of "unknown" type. To overcome this, I utilized google maps and other Singapore maps to identify the type of these buildings, which mostly ended up to be either of type "residential" or "military". There are a total of 10 types of buildings in Gombak, with majority (473 of total 523 buildings) being residential. It is keen to note that residential buildings mostly occupy the 7 to 1 o'clock boundary ridges of Gombak, whereas military buildings occupy the centre portion.
Natural Conservation Factor (Natural Features)
The site should avoid natural features such as forests, water bodies and parks, of which there are 1, 3 and 4 respectively. Parks are scattered across the western region of Gombak, whereas the lone forest is located in the eastern region, amidst the military buildings. The water bodies however, are split to 1 central catchment area in the northern region, and 2 long strips running down along the eastern region.
Economic Factor (Digital Elevation)
The selected site should avoid steep slope. This is because construction at steep slope tends to involve a lot of cut-and-fill and will lend to relatively higher development cost. The lowest point in Gombak is 8 meters above sea level, whereas the highest point is up to 143 meters above sea level. Not surprisingly, most buildings are located on the flatter regions, with majority of roads on the low lying areas as well; presumably to cater to the greater amount of human traffic in that region.
Proximity Analysis
To select the most optimal site for constructing the quarantine centre, we must take into account the distance from the quarantine centre to points of interest that we wish to avoid eg: the quarantine centre cannot be constructed in the middle of a neighborhood. Hence a proximity analysis with each of the 4 aforementioned factors is required.
It is important to note at this point that the quarantine centre has a rather large contagious area of at least 10,000m2 and this study solely focuses on Gombak and not its surrounding area, meaning that the proximity analysis might not be accurate. For example, within Gombak, there might a location near the outskirts of Gombak which seems ideally far enough from POI that we are worried about, but there might be a cluster of residential units outside of Gombak that lie right besides it. This will be explored later when deducing the most suitable plot of land for the construction.
Roads Proximity
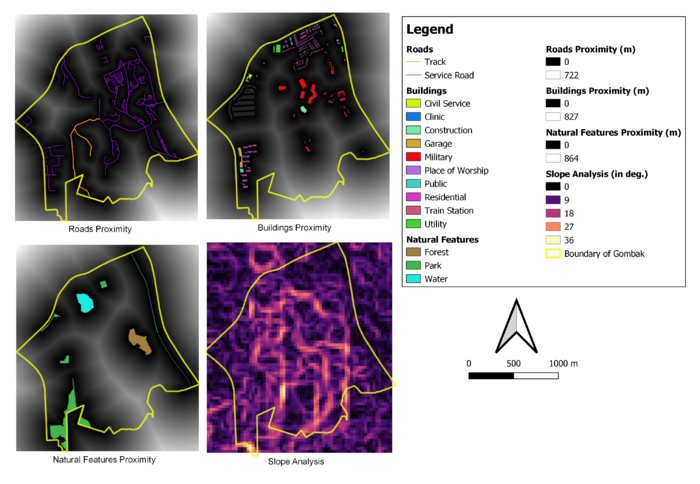
The distance between roads vary between 0m and 722m. Darker regions represent regions where the roads are close together, whereas lighter regions represent areas with roads further apart. It is keen to note that there are 2 regions in the west and south-south-east that have roads that are further apart compared to other regions in Gombak.
Buildings Proximity
The distance between buildings vary between 0m and 827m, with the darkest region of the map representing the latter. Land lots with lighter regions are more ideal for the construction of the quarantine centre as the lack of buildings near it signifies that there is lesser human traffic in that area. The northern region has a significantly higher density of buildings as compared to the other areas of Gombak.
Natural Features Proximity
The distance between natural features vary between 0m to 864m, where the region of furthest separation cuts through the middle of Gombak. Similarly to the previous 2 features, lighter plots of land represent regions with the greatest distance between features, and darker regions the converse.
Slope Analysis
The slope analysis is done by calculating proximity to digital elevation. The steepness of land varies from 0 degrees (completely flat land) to 36 degrees. Despite how varied the steepness of the map might display, majority of the land falls between the region of 0 to 18 degrees, which bodes well for selecting the most ideal flat land for construction of the quarantine centre.
Criterion Scores
In order to draw useful insights from the proximity analysis, normalization or standardization must first be done to ensure that all factors are on the same scale of comparison. I decided to proceed with normalization, normalizing the proximity analysis of roads, buildings, natural features and slope analysis. Acquiring the criterion scores for roads and slope analysis required an additional step as compared to buildings and natural features. In the case of roads, we want the quarantine centre to be close to roads for ease of transportation, which is the opposite of what we look out for in buildings and natural features. Similarly for slope criterion, we want the location to be as flat as possible. In general, the blue regions of the maps are desired, and red/white regions are to be avoided.
| Factors | Criterion Scores |
|---|---|
| Accessibility | 1 - Normalized Roads Proximity scores |
| Health Risk | Normalized Buildings Proximity scores |
| Natural Conservation | Normalized Natural Features Proximity scores |
| Economic | 1 - Normalized Slope analysis |
Accessibility Criterion
The criterion scores for Accessibility factor is calculated with "1 - Normalized Roads Proximity scores". Plots of land that are nearer to roads are desired, hence there was a need to "invert" the scores. Blue regions are preferred over white ones, as these are in closer proximity to service roads and tracks.
Health Risk Criterion
Unlike calculating the criterion scores for roads, there is no need to invert the scores after normalizing the buildings proximity scores, as plots of land further from buildings are preferred. The blue regions represent plots of land that are more distant from any buildings, hence desired as the risk of the disease spreading is reduced.
Natural Conservation Criterion
Similar to calculating the criterion scores for Health Risk factor, the criterion score for natural conservation factor is calculated by normalizing the natural features proximity scores. There is no need to deduct 1 as plots of land that are further from natural features are desired.
Economic Criterion
The criterion scores for Economic factor is calculated with "1 - Normalized Slope analysis". After normalization, plots of land that have steep slopes will have higher scores, but as our ideal plot of land is one that is flat, we deduct the normalized slope analysis by 1 to find the inverse, to give flat lands a higher score.
Analytical Hierarchical Process (AHP) Input Matrix and Result Report
The AHP serves as a means of ranking the respective criteria based on their relative importance between each the individual pairs. The order in which I chose to prioritize the factors was Health Risk, Accessibility, Natural Conservation and lastly Economic, which can be seen from their respective AHP scores of 53.6%, 22.9%, 15.7% and 7.7%. I ranked Health Risk as the most important criteria as I felt that the other 3 criteria could be sacrificed/ worked around, but the safety and human well-being is something that should never be sacrificed. Economic reasons was rated with the least priority as I felt that budget should not be an issue when constructing a building of National importance.
Suitable Land Lots
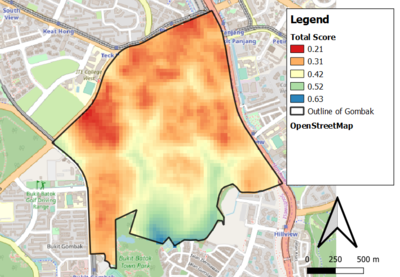
Land Lots analysis is the culmination and end product of the entire study. With the criterion scores calculated and the AHP scores for each factor, we are able to weigh the different criterion and sum them together, creating a Total Score analysis that we can then use to determine the most suitable plot of land for construction of the quarantine site. The Total Score is calculated as such: "Health Risk Criterion"*0.536 + "Accessibility Criterion"*0.229 + "Natural Conservation Criterion"*0.0157 + "Economic Criterion"*0.077.
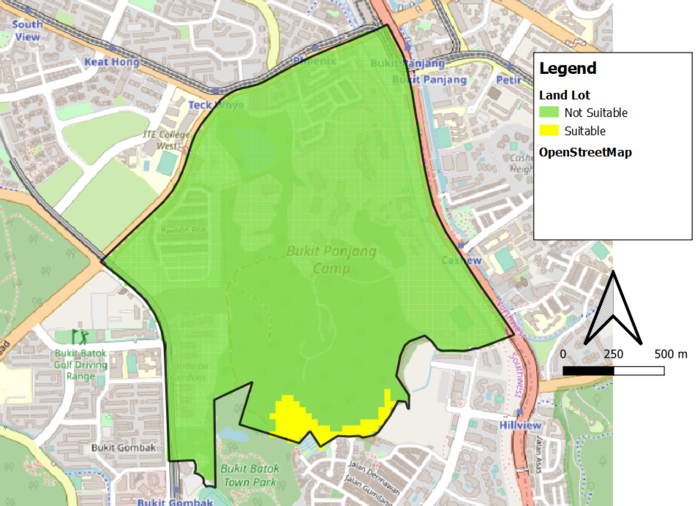
As seen from the raster map above, the southern tip of Gombak is the region with the highest total score, hence the most suitable location for construction of the quarantine centre. The other regions ranges have poor total scores ranging from 0 to 60, further reinforcing that the quarantine centre should not be located anywhere else. For this study, I have identified suitable plots of land to be those with Total Score >= 80.
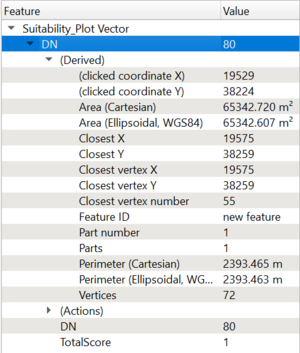
Hence we can see that the only suitable plot of land lies in the southern tip of Gombak, with a total land area of 65,342m2. As mentioned in the study earlier, as this focus purely focuses on the features within Gombak, we must weary of features that lie outside of Gombak when considering the location of construction site as it will affect the Total Score for Land Suitability Analysis. For instance, we can see that there is a cluster of residential buildings that reside beside our selected land plots for the construction, well within the contagious area of 10,000m2, which is a glaring cause of concern. In order to determine the most optimal building site within Gombak, further analysis is required; to include the area, and its residing features, around Gombak.
