SMT201 AY2018-19T1 EX2 Aaron Lee Tian En
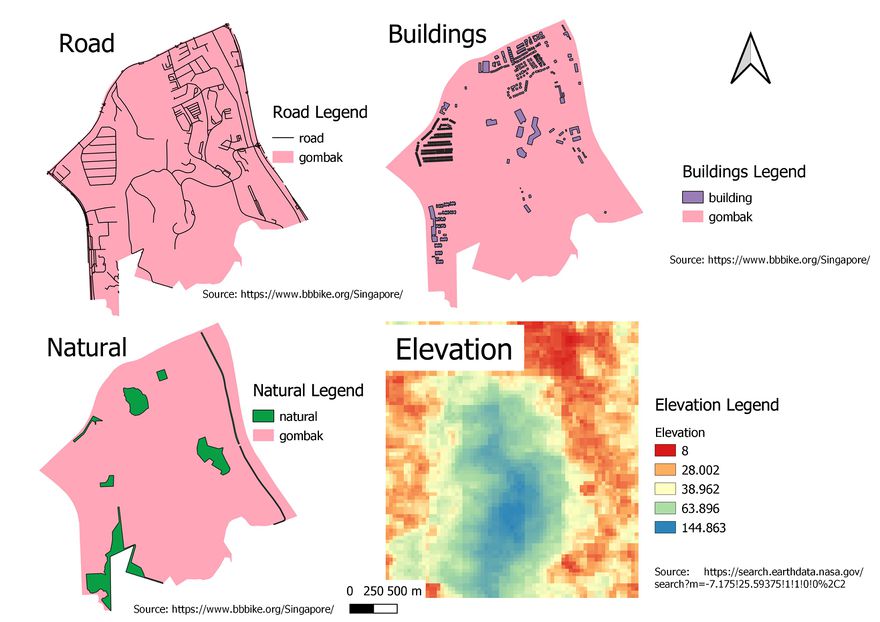
View 1 shows the Road Network in Bukit Gombak. It has all major and minor roads. View 2 shows the Building map in Bukit Gombak. View 3 shows the Natural features, all parks, water features are all green in this study. View 4 shows the elevtion in Bukit Gombak. Red are lower lying areas and Blue are higher grounds.
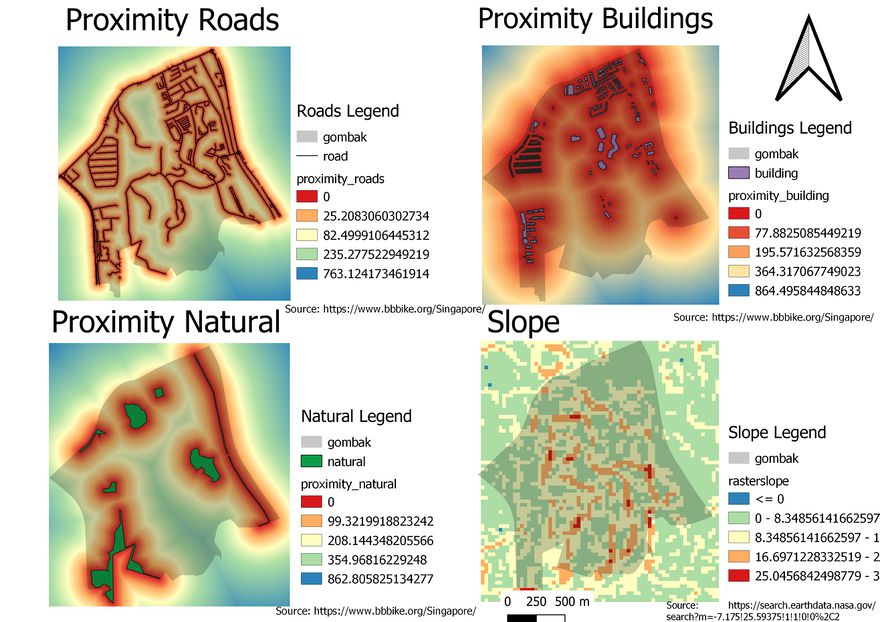
View 1 is the proximity map for roads and the colour gradients represent different quantiles. The Red areas are closer to buildings and Blue areas are further from buildings. View 2 is the proximity map for buildings and each colour shows the distance away from the buildings. Red areas are closer and blue areas are further from buildings. View 3 is the proximity map for natural features. Red areas are closer while Blue areas are further from natural features. View 4 is the Slope map which is the difference in elevation in Map 1 above. Our project aims to put a Communicable Disease Centre away from slopes so as to reduce the economic factor whilst building the centre.
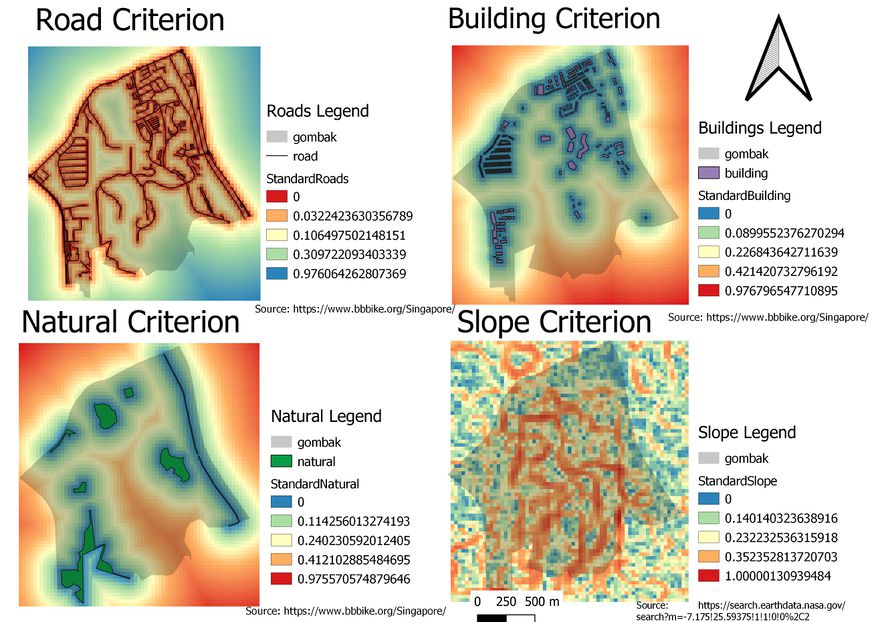
View 1 is the standardised criterion scores for roads. The red areas are higher scores and its better to put a centre nearer roads. View 2 is the standardised criterion scores for buildings. The higher scores are red, because its better to place the centre far from buildings. View 3 is the standardised criterion scores for natural features. Similarly, we also aim to place the centre as far from natural features as possible. View 4 is the standardised criterion scores for slope. A lower score is better to put a centre there because we want to avoid steep slopes. For all the above standardisation, I used Max-Min formula.
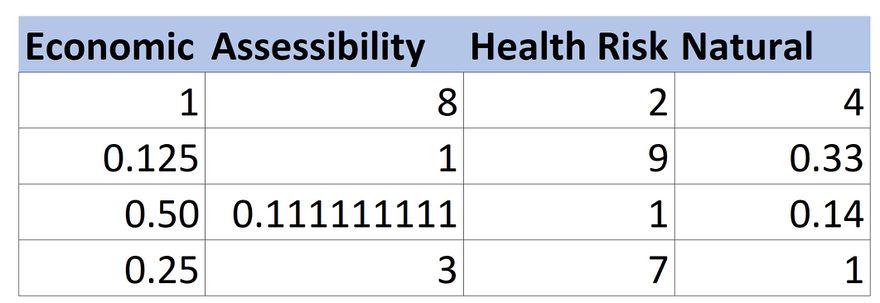
I chose to weigh the accessibility factor at 8, Health risk at 2 and Natural at 4.
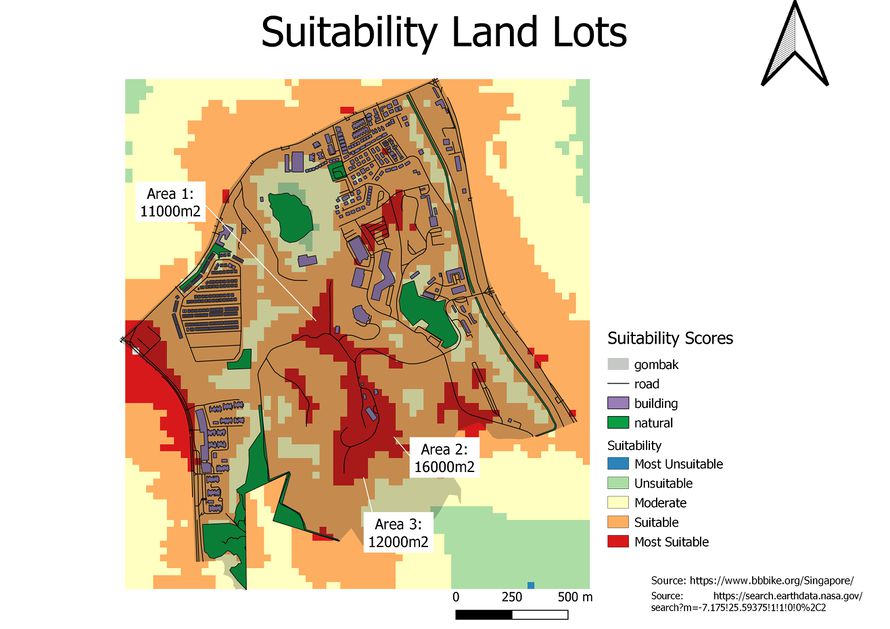
Using raster calculator to add all the factors with each AHP weight, we arrive at the above map showing the red areas are suitable for the centre to be put at. There are 3 areas chosen with the help of the "Measure Area" Tool to determine if the areas are greater than 10000m squared. Additionally, the areas chosen cannot overlap current roads, so those that fit the requirements are these 3 areas above. The formula used was (1-"StandardSlope@1")+(4*"StandardNatural@1")+(2*"StandardBuilding@1")+(8*(1-"StandardRoads@1"))
