G2-Group07
| Proposal | Poster | Web Maps | Report |
Project Motivation
While we were doing our initial research, we found out that the Jurong West planning area was originally filled with swamps and jungles in the 1960s, before the government developed the area into an industrial estate with low-cost housing for workers. In the 1970s, Jurong West further developed with the formation of residential and commercial estates such as Boon Lay, Taman Jurong, and Hong Kah. In 1984, HDB began to expand further by adding Pioneer and other neighbouring towns. Today, Jurong West continues to evolve with the upcoming Jurong Lake District that will transform the planning area into an attractive location to live, work and play. Being an area where there is always continuous change and development, we were naturally attracted and interested to find out how land use has changed recently, and how we could further improve Jurong West amidst the continuous development.
Project Objective
The project aims to recommend improvements and new infrastructure or features by analysing the changes in land use from 2008 to 2014 and a projecting the demographics structure from 2008 and 2014 to 2024. There will be a thorough and comprehensive analysis of the surrounding land and features of the recommended site of improvement and new infrastructure/features by using GIS techniques on QGIS.
Data Sources
Data was sourced from data.gov.sg and Singstat.gov.sg, which are websites run by the Singaporean government with data available for the public’s consumption. The planning area and land use boundaries were sourced from 2008 and 2014’s Master Plans. The demographic data used for the projection was sourced from Singapore residents data under geographic distribution in Singstat.gov.sg. News and official government press releases and data will be also used to give us information and insights into how we can go about providing recommendations based on the geospatial analysis we have done.
| Data Name | Data Format | Sources | |
|---|---|---|---|
| Landuse (2008/2014/2019) | |||
| URA Planning Areas (2008) | Shape files | https://data.gov.sg/dataset/master-plan-2008-planning-area-boundary-no-sea | |
| URA Planning Areas (2014) | Shape files | https://data.gov.sg/dataset/master-plan-2014-planning-area-boundary-web | |
| URA Planning Areas (2019) | Reference | https://www.ura.gov.sg/Corporate/Planning/Draft-Master-Plan-19 | |
| Population | |||
| Population (2015) | CSV | https://www.singstat.gov.sg/find-data/search-by-theme/population/geographic-distribution/latest-data | |
| Population (2019) | CSV | https://www.singstat.gov.sg/-/media/files/publications/population/population2019.pdf | |
| Profession | CSV | https://www.tablebuilder.singstat.gov.sg/publicfacing/createSpecialTable.action?refId=8321 | |
| Education & Healthcare Services | |||
| Childcare Services | Shapefile | https://data.gov.sg/dataset/listing-of-centres | |
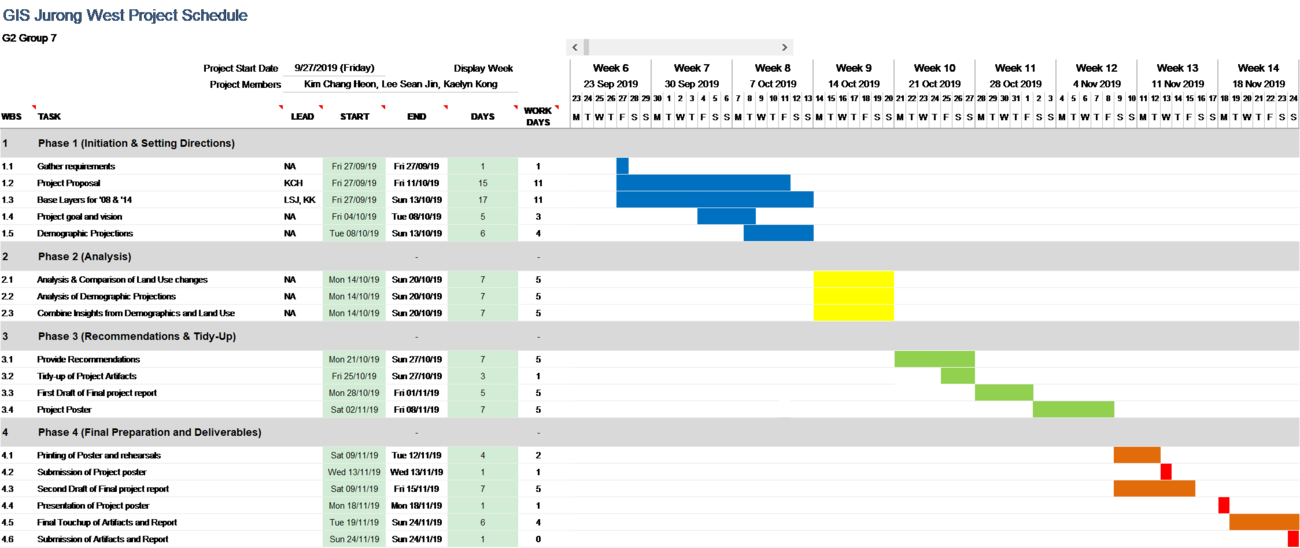
Scope of Work
| 1 | Phase 1 (Initiation & Setting Directions) |
|---|---|
| 1.1 | Gather Requirements |
| 1.2 | Project Proposal |
| 1.3 | Base Layers for 2008 & 2014 |
| 1.4 | Project Goal and Vision |
| 1.5 | Demographic Projections |
| 2 | Phase 2 (Analysis) |
| 2.1 | Analysis & Comparison of Land Use changes |
| 2.2 | Analysis & Demographic Projections |
| 2.3 | Combine Insights from Demographics and Land Use |
| 3 | Phase 3 (Recommendations & Tidy-up) |
| 3.1 | Provide Recommendations |
| 3.2 | Tidy-up of Project Artifacts |
| 3.3 | First Draft of Final Project Report |
| 3.4 | Project Poster |
| 4 | Phase 4 (Final Preparation and Deliverables) |
| 4.1 | Printing of Poster and Rehearsals |
| 4.2 | Submission of Project Poster |
| 4.3 | Second Draft of Final Project Report |
| 4.4 | Presentation of Project Poster |
| 4.5 | Final Touch-up of Artifacts and Report |
| 4.6 | Submission of Artifacts and Report |


