G2-Group06
| Introduction |
What comes to your mind when you first heard the word ‘Punggol’? Most people would probably say that it's going to be a “hype” place to live in as the government is doing many redevelopments in the area just because it's pretty much located to malls and modern architecture objects. Some would even say that getting a BTO at Punggol would rather an investment for the future. Now, we might have observed pixelated motivation behind what makes a good place to live, not based on property value but one that fits the needs of residents. This project will resort to the revaluation of current developments in Punggol by emphasising to the future needs of the Punggol citizens. We will also take into account the current plan for Punggol under the Draft Masterplan 2019 to bring in insights and recommendations to better cater to the needs of Punggol residents. Our priority will be ensuring that in 5-10 years down the road, Punggol can be a place to live, work and play.
| Current Infrastructure(s) to 2019 | Planned Infrastructure(s) to 2025 |
|---|---|
| Smart Towns and Homes architects and engineers use smart planning tools and data analytics to analyse the wind flow, solar irradiance and shaded areas within a town, and determine how best new flats can be designed and sited to provide maximum thermal comfort and a more conducive living environment for residents |
Open Digital Platform centralise the data collection of single estate systems (facilities, building and estate management systems, district cooling system, pneumatic waste conveyance system, autonomous goods delivery systems, access and security systems, carparks system, traffic lights system, and autonomous vehicles) |
| Transportation Punggol LRT, MRT, Bus Interchange |
Centralised Logistics Hub A single stop where all goods can be dropped off and picked up, improving productivity and reducing traffic |
| Amenities Waterway@Punggol |
District Cooling System Centralises cooling needs, expect space and cost savings with a reduction in the district’s carbon footprint |
| Pneumatic Waste Collection A district-wide underground vacuum-pipe network, this would eliminate the need for waste collection trucks and eradicate the odour from refuse chutes. |
|
| Smart Energy Grid Enable consumers to adopt clean sources of energy for daily use (e.g. charging electric vehicles), facilitate greater energy efficiency and savings (e.g. through smart metering). |
| Project Objective |
- Plan for human beings, we will make resident-centered recommendations to meet the future needs of Punggol Residents.
- Re-examine the Masterplan set for 2019 by synchronising the Government’s vision for Punggol and resident’s needs.
- Perform observation and analysis in micro-level subzone level in Punggol planning area and subzones.
| Scope of Work |
There are many different subjective facets to consider when it comes to deciding what makes a good living area. This project will be narrowed down to factors that covers at least basic needs of living. We will be mainly considering from the landuse perspecive to identify what has and what hasnt been done. Some of our current factors will be looking at:
- Which parcel of land goes to housing, services (residential, elderly care etc)
- Green recreational, healthcare, hospital, education (allocation is based on map classification)
- Office area promiximity and its accessbility
- Plans for empty lands or pocket of land we can recommend, as Ounggol is still currently filled with unused lands
- Any possible recommendations for land acquisition
- Any possible changes for current use of land (Eg: Community Centres can be an avenue for Child centres)
- Any possibilities of acquiring low-rise private properties
| Data Sources |
| Data | Source | Remarks |
|---|---|---|
| Masterplan 2018 Land Use | [1] | - |
| Master Plan 2008 Subzone Boundary (No Sea) | [2] | Used to extract Punggol Planning Area and its Subzones inside |
| Master Plan 2014 Subzone Boundary (No Sea) | [3] | - |
| Singapore Residents by Planning AreaSubzone, Age Group, Sex and Type of Dwelling, June 2011-2019 | [4] | Used for Punggol Population Analysis |
| Roads, buildings, land use data from OpenStreetMap (OSM) data sets | [5] | - |
| Education data sets | [6] | - |
| Bus stops | [7] | - |
| MRT/LRT Stations | [8] | - |
| PASSENGER VOLUME BY ORIGIN DESTINATION BUS STOPS, SEP 2019 | [9] | - |
| PASSENGER VOLUME BY ORIGIN DESTINATION BUS STOPS, SEP 2019 | [10] | - |
| Train data points | [11] | - |
| Bus Stop data points | [12] | - |
| AHP Template provided by SCB Associates | [13] | - |
| Childcare & Schools | [14] | - |
| CHAS Clinic Locator in Punggol | [15] | Used the name, address and postal code of each clinic for geocoding of individual clinics |
| Hospitals near Punggol | [16] | Used the name, address and postal code of each hospital near Punggol for geocoding of individual hospitals |
| Eldercare Centres in Punggol | [17] | Used the name, address and postal code of each eldercare centre in Punggol for geocoding of individual eldercare centre |
| ASTER Global Digital Elevation Model (GDEM) dataset jointly prepared by NASA and METI, Japan | [18] | Used for evaluating factor of slope while evaluating land suitability for new facilities |
| Population Growth Trend & Forecast | [19] | - |
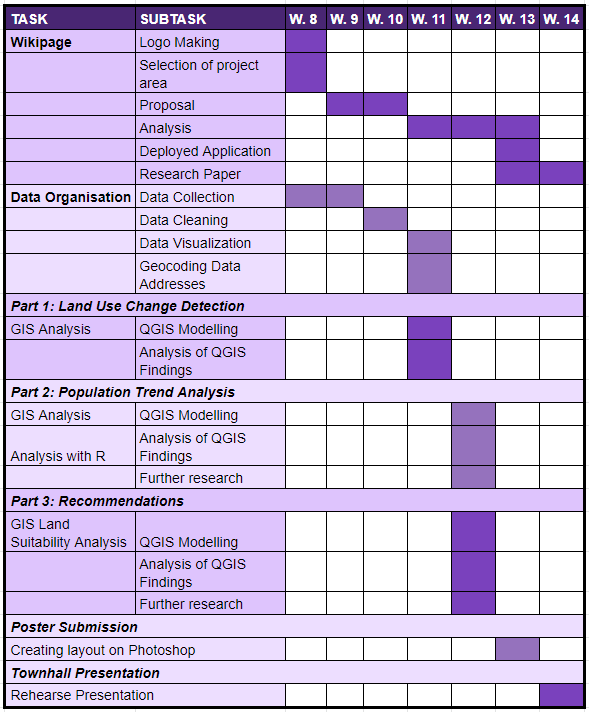
| Project Timeline |
| Overview System Architecture Diagram |
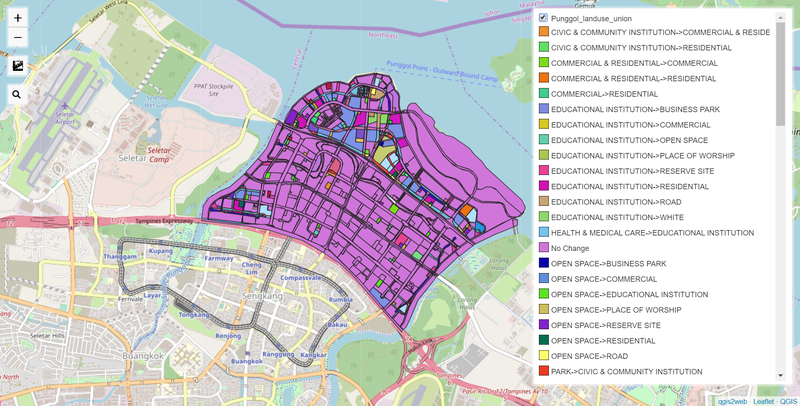
We used the plugin on QGIS called `Qgis2Web` that helps make our maps interactive and deployable on any browser. The relevant files were connected on Heroku, via Github. The following is a screenshot of one of our web applications.
View the actual web application on the tab `Deployed Application`.
| Application Overview (Analysis Methods) |
| 1. Land Use Changes via Categorization and Geometry Checking |
To detect the land use changes, the land use layer for both 2008 and 2014 was subjected to categorization, unification, and geometry checks. Due to geometry errors that arises during union, it was important to carry out the step of checking the geometries. To understand the changes, we ranked the different changes by the area it occupies to determine what Punggol changed most into. We compiled the top 3 changes and confirm the changes against Punggol demographics. The final layer was then deployed as a leaflet web application.
| 2. Population Trend Analysis |
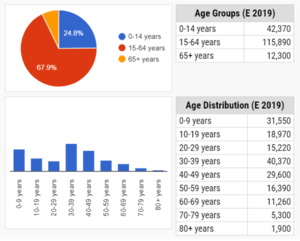
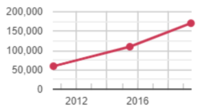
The population of Punggol is steadily increasing, with more young couples flooding into the district. Since there was an increase in the number of subzones in Punggol, the population trend analysis was conducted for each subzone instead, to obtain a more representative trend analysis. From this, we are able to suggest apt facilities that reflects the needs of each subzone.
| 3. Land Suitability & Network Analysis |
Understanding that there lack a number of basic amenities due to the influx of younger population, our group conducted a land suitabiility analysis targetted at specific age groups (the younger population, the elderly, and the economic class along with their families). Through this analysis, we hope to determine the best plot of land that can integrate certain new facilities such as childcare centres, primary schools, eldercare centres and family clinics. We also analyzed the travelling patterns of Punggol Residents, and thereby re-evaluate the goal of making Punggol a place to Work, Live, Play & Learn.
