G2-Group03 Final Report
Contents
Introduction
Choa Chu Kang is a planning area and residential town located at the north-westernmost point of the West Region of Singapore. The name "Choa Chu Kang" is derived from the Teochew word "kang chu". In the nineteenth century, Chinese immigrants to plant gambier and pepper along the river banks of Choa Chu Kang, although many migrated to Johor to the north at the encouragement of Temenggong, Johor. The plantation owners were known as Kangchu - the word "kang" refers to the riverbank and "chu" means "owner" or "master", referring to the headman in charge of the plantations in the area. "Choa" is the clan name of the first headman. Choa Chu Kang has a total area of 6.11 km2. As of the Master Plan 2014, Choa Chu Kang planning area is made up of 6 subzones: Choa Chu Kang Central, Choa Chu Kang North, Keat Hong, Peng Siang, Teck Whye and Yew Tee. It has a total population of 190,720 (as of June 2019) and population density of 31,265km2.
Objectives
1. Determine if current amenities and facilities will be able to meet the needs of the projected population of Choa Chu Kang in 2024, especially that of the infants (ages 0 to 4), working population (ages 25 to 64) and elderly (ages 65 and above).
2. Determine and select ideal locations in Choa Chu Kang for future amenities to be built to meet the needs of the aforementioned age groups.
Areas of Reseach
Education
The Singaporean government consistently places a large emphasis on education. Every young Singaporean is given multiple opportunities to further their studies in their areas of interest. Hence, education institutions in Singapore are strategically placed such that the majority of the population has access to these institutions. In Choa Chu Kang, there are multiple educational institutions that cater to the needs of the various age groups.
Healthcare Facilities
As the population of elderly residents in Singapore is expected to increase, there has been an increase in the number of healthcare facilities for the elderly throughout the island. As urban planners, we will be analysing the ratio of healthcare facilities to the population of elderly residents in Choa Chu Kang to determine if the current number of facilities available are able to meet their needs.
Transport
There are various transportation facilities within the Choa Chu Kang planning area, namely Choa Chu Kang MRT station, Yew Tee MRT station, Choa Chu Kang Bus Interchange and Bukit Panjang LRT system. These facilities provide ease of access for commuters to travel within Choa Chu Kang and from Choa Chu Kang to the Central and Downtown area of Singapore. Furthermore, the Bukit Panjang LRT system provides residents with convenient access to the town centre and to the nearby town of Bukit Panjang.
Task 1 Change Detection
What are the changes between Master Plan 2008 and Master Plan 2014?
| Year 2008 | Year 2014 |
|---|---|
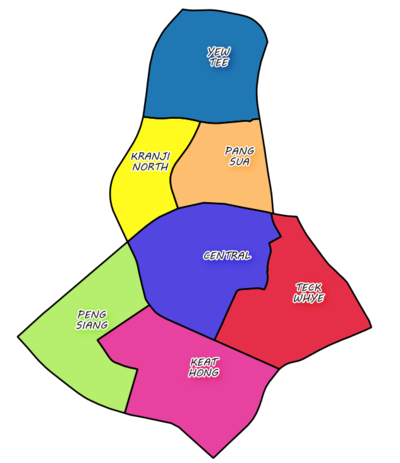
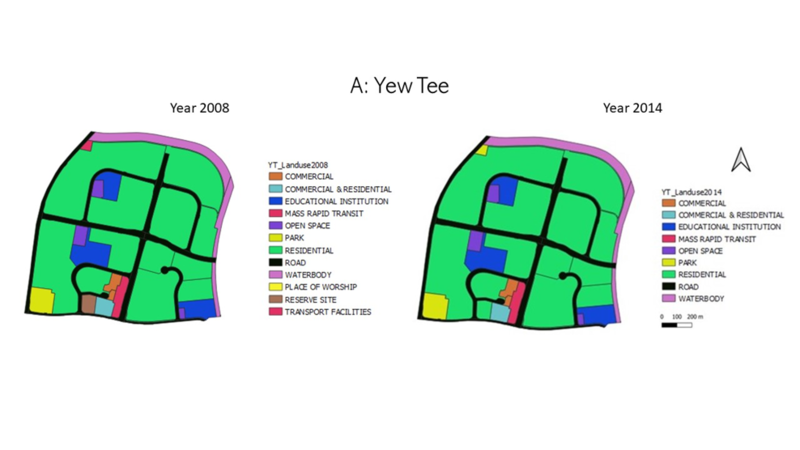
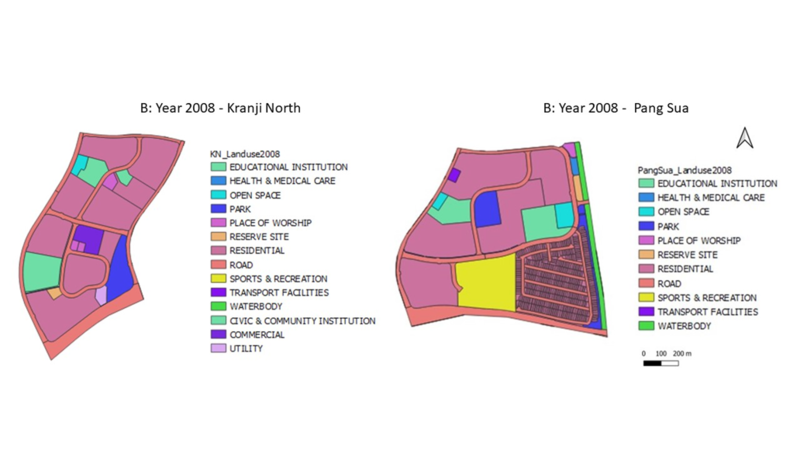
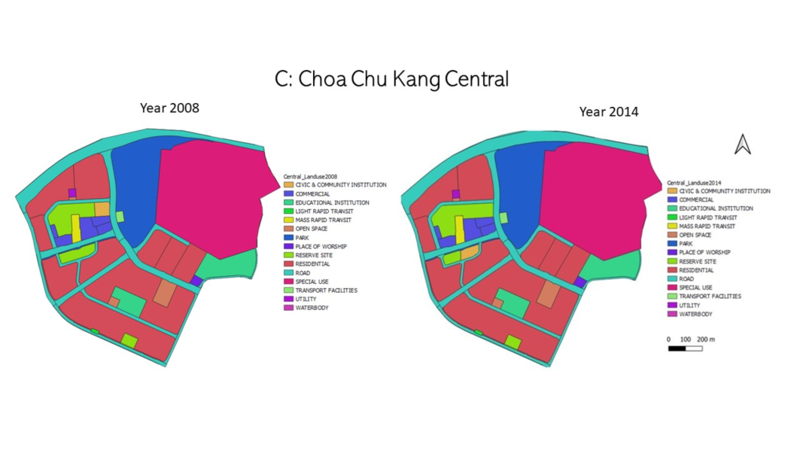
In Master Plan 2008, Choa Chu Kang has 7 subzones: Yew Tee, Kranji North, Pang Sua, Central, Peng Siang, Keat Hong, Teck Whye.
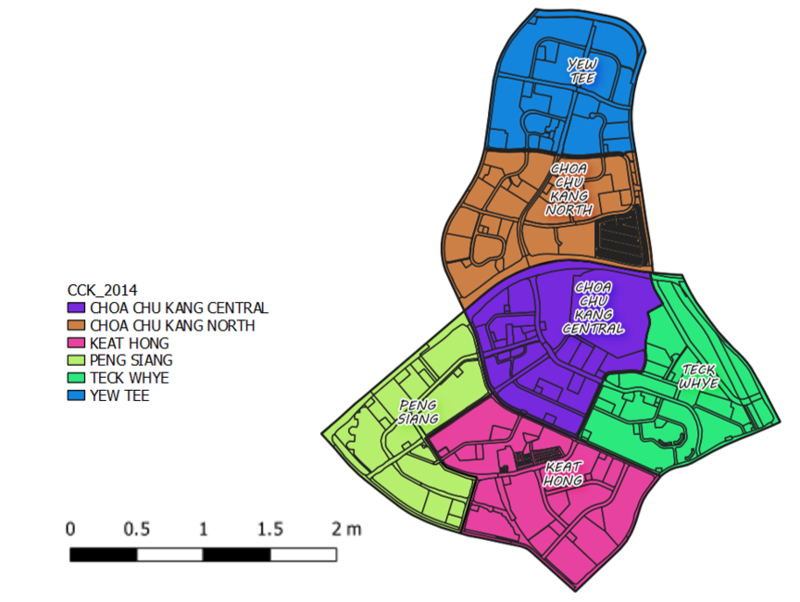
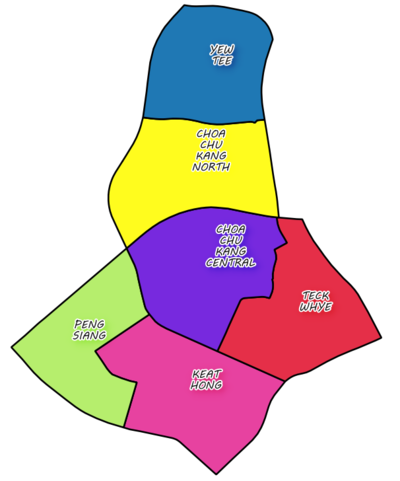
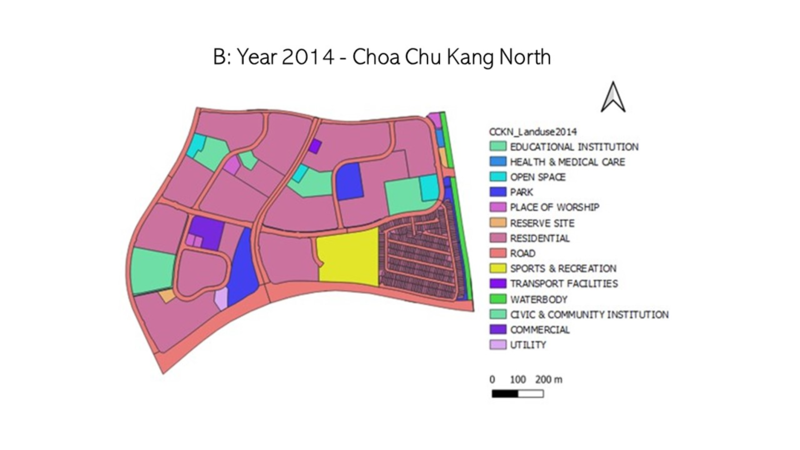
In Master Plan 2014, Choa Chu Kang consists of 6 subzones: Yew Tee, Choa Chu Kang North, Choa Chu Kang Central, Peng Siang, Keat Hong, Teck Whye.
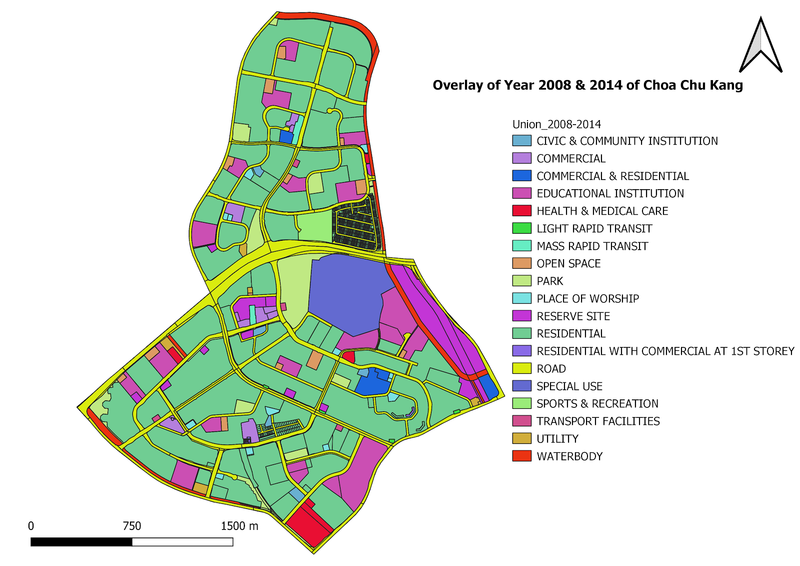
Overlay of Choa Chu Kang 2008 and 2014
Transformation Matrix of 2008 against 2014
Residential area analysis 2014
From Master Plan 2008 to 2014, about 67664.14m2 of Reserve site was converted to Residential land use. Both Park and Educational Institution land use area has decreased to make way for more Residential land use at 12505.55m2 and 17934.52m2 respectively. The residential land use in 2008 has also decreased by 51917.51m2 for Road land use and 22238.27m2 for Park land use. Overall, there is still a net land gain of 23948.42m2 for Residential area in 2014.
Road area analysis 2014
From Master Plan 2008 to 2014, we can clearly identify that the residential area and park area in 2008 has reduced in 2014 to build more roads. Road land use has gained a total of 13803.31m2 from Parks and 51917.51m2 from Residential area. There was no land loss for roads amenities from 2008 to 2014.
Park area analysis 2014
From Master Plan 2008 to 2014, there was a net decrease in land use area for Parks. Despite gaining 22238.27m2 from Residential land use in 2014, Park land use area decreased by 13803.31m2 for Road land use and 12505.54m2 for Residential land use in 2014. Therefore, there is a total loss of 4070.58m2 for Park land use.
Education area analysis 2014
From Master Plan 2008 to 2014, there was a net land gain area for educational area. Despite a decrease of 17934.52m2 to Residential, they also gained 21850.26m2 from Residential area. Therefore, Education area has increased by 3915.73m2. This land use area gained for Educational purposes can be found in subzone Keat Hong.
Health and Medical care 2014
From Master Plan 2008 to 2014, the Health and Medical Care land use area increased by 48068.70m2. It was a net gain as there was no land loss from the Health and Medical Care area. This is the second biggest land gained from Reserve Site after Residential area. This major land gain can be found in subzone Keat Hong.
Subzone Area Change from Year 2008 to Year 2014
Comparison Analysis:
In the 2008 Master Plan, a section of reserved site with an area of 7182.69m2 has been transformed into a residential area by 2014. Furthermore, the Transport Facilities land use area in 2008 with an area of 2376.75m2 has been entirely converted into Park land use in 2014. | |
| |
Comparison Analysis:
In 2008 Master Plan, CCK North did not exist. The area was split into 2 smaller subzones - Kranji North and Pang Sua. From 2008 to 2014, there was no change in Kranji North land use. In 2014, the two subzones were combined to form Choa Chu Kang North which has an area of 1428268.59m2. 1690m2 of Park land use in Pang Sua was converted to widen the Roads network in 2014. The reserve site area has also given up 1106m2 of land to widen the only road to the expressway. |
Comparison Analysis:
According to the 2008 Master Plan, Civic & Community Institution land use with an area of 5740.24m2 has been completely converted into Park land use in 2014. However, a section of the Park area in 2008 has also been converted into 4835.46m2 of Civic & Community Institution land use. In conclusion, Civic & Community land use area only has a net loss of 904.58m2. | |
Comparison Analysis:
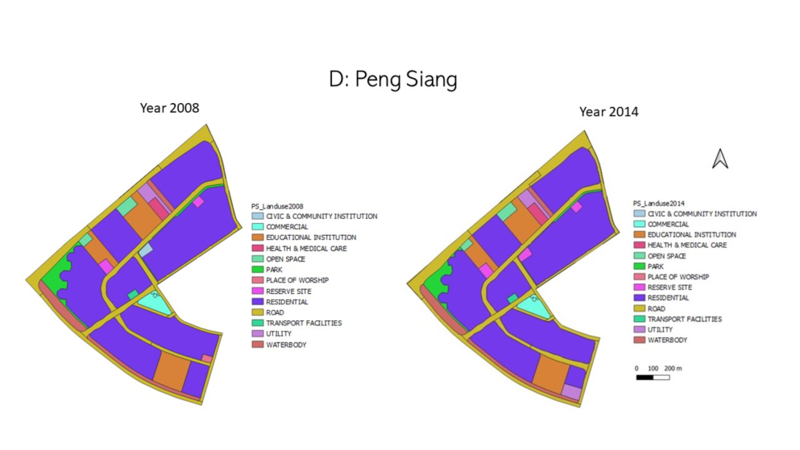
In the 2008 Master Plan, there is one Place of Worship with an area of 2021.57m2 which was converted into residential area in 2014. In 2008, there was only 1 utility area with an area of 8589.62m2. In 2014, 6538.44m2 of residential area was converted into utility area. Additionally, the largest increase in land use in Peng Siang is the Road landuse. It increased by a total of 534737.07m2 from 2008 to 2014.Lastly, in 2008, 3256.33m2 of Civic & Community Institution land use area was entirely converted into a reserve site in 2014. The 2014 total reserve site area is 9516.13m2. | |
Comparison Analysis:
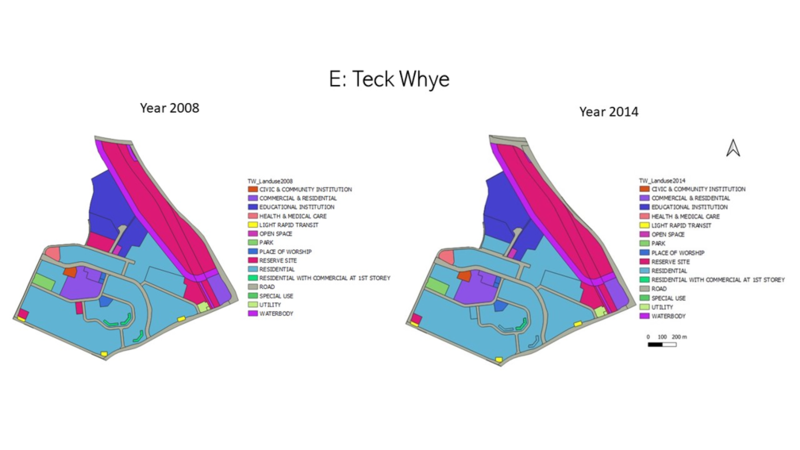
From 2008 to 2014, there was a total decrease of 20390.81m2 from Reserve Site. Road landuse experienced a net land gain of 152809.96m2 from the reserve site. For Special Use land use area, it decreased by 3843.09m2 from 2008 to 2014. In addition, the residential area has a net increase in land use area of 139180.26m2. | |
Comparison Analysis:
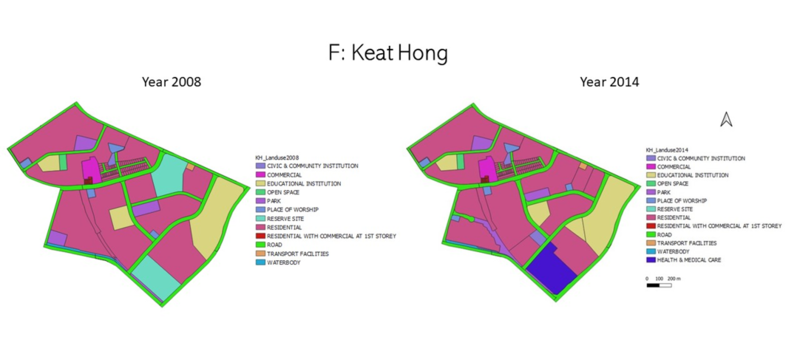
In the Master Plan 2008, there was 660214.81m2 of Residential area. The southernmost area of Reserve site has been converted into 63046.51m2 worth of Health & Medical Care Area. Above the Medical care area, there is a newly built Civic & Community Institution that was converted from 7061m2 of Residential area. In 2014, the Educational Institution above the Civic & Community Institution has taken over the previous Park land use area from 2008. Overall, there was a large increase in land use area for Educational Institution by 12120m2. Residential land use area has also increased by 33853m2 worth of land in 2014.Lastly, the place of worship has a net land gain of 2001m2 from the residential area. The place of worship is widely spread around the Keat Hong subzone. |
Task 2 Population projection till 2024
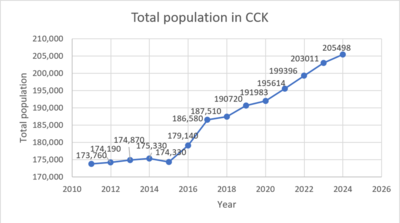
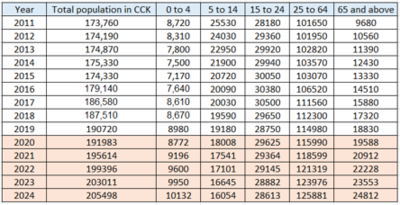
In order to get the projected population numbers for every year up till 2024, we used an Excel function, FORECAST.LINEAR(), to do a linear projection. This Excel function analyses the trends of the population in Choa Chu Kang from 2011 to 2019 and predicts future populations based on this trend. Total population numbers for each year is then plotted into a linear graph as shown below.
| Total Population Prediction in Choa Chu Kang | Data Analysis |
|---|---|
After applying the Excel function FORECAST.LINEAR() to the historical population data, it is predicted that Choa Chu Kang will have a total population of 205,498 in 2024. The population of young children (aged 0-4) is expected to increase by 15.5%, from 8772 in 2019 to 10132 in 2024. More than half (61%) of the total population in 2024 will be contributed by the working population (ages 25 to 64), while the elderly (ages 65 and above) will contribute to 12% of the total population in 2024.
In order to get more representative numbers, we also made the assumption that the spread of young children aged 3-6 and elderly aged 65 and above are consistent throughout the entire Choa Chu Kang planning area.
Choa Chu Kang Central
The current population in Choa Chu Kang Central is 22,230. This number is expected to increase to 22,991 in 2024.
Choa Chu Kang North
Currently, Choa Chu Kang North has a population of 32,440 residents (2019). According to projection data, the population in this subzone is expected to drop to 31,304.
Keat Hong
This year, Keat Hong has a total population of 36,960. This number is expected to increase to 52,816 in 2024.
Peng Siang
Peng Siang has a population of 33,420 this year (2019). Our data projections predict that Peng Siang’s population will increase to 36,000.
Teck Whye
Currently, Teck Whye has a population of 24,720 residents. The population in this subzone is predicted to decrease to 23,129 in 2024.
Yew Tee
The current population of Yew Tee is 40,950 (2019). This number is predicted to decrease to 37,756 in 2024.
Population ratios for Clinics, Eldercare Facilities & Preschools
Preschool
The following table shows the number of preschools that can be found in the respective subzones in Choa Chu Kang. As the population data collected does not provide the number of children in pre-schools, we assumed that the number of children at each year of age is equal.
| Subzone Name | Number of Preschool | Population in 2019 | Population in 2024 |
|---|---|---|---|
| Choa Chu Kang Central | 6 | 764 | 678 |
| Choa Chu Kang North | 14 | 962 | 430 |
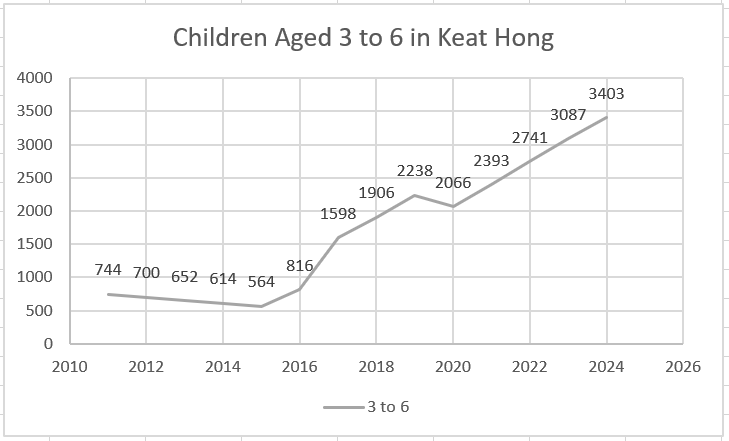
| Keat Hong | 16 | 2238 | 3403 |
| Peng Siang | 12 | 1300 | 1313 |
| Teck Whye | 13 | 676 | 402 |
| Yew Tee | 12 | 1488 | 769 |
Keat Hong has the highest number of preschools, 16, compared to other subzones in Choa Chu Kang planning area. With further calculations, Keat Hong has a ratio of 1 pre-school for every 140 children (aged 3-6). It is predicted that the population size will increase to be the largest, 3403, by 2024. By then, the ratio will increase to 176 children for every pre-school.
In Peng Siang, there are 12 preschools located in the subzone. The current population of children eligible for pre-school is 1300, which indicates that each pre-school serves 108 children. This number is expected to increase to 109 children per pre-school.
Teck Whye has a population of 676 children and 13 pre-schools, which indicates that each pre-school can cater to 52 children. This number is expected to decrease to 30 children per pre-school in 2024.
The current population of children in Choa Chu Kang North is 962, with a total of 14 pre-schools. Each pre-school can cater to the needs of 68 children. This number is predicted to decrease to 31 children per pre-school in 2024.
In Yew Tee, there are 12 pre-schools and 1488 children. Hence, each pre-school can serve 124 children. This number is predicted to decrease to 64 in 2024.
In Choa Chu Kang Central, it has a current population of 764 children and 6 pre-schools. Each pre-school serves 127 children. This number is expected to decrease to 112 children in 2024.
Eldercare Centre
The table below highlights the number of Eldercare Facilities that can be found in each subzone in Choa Chu Kang (CCK). Elderly residents refer to residents who are aged 65 years old and above.
| Subzone Name | Number of Eldercare Centres | Population in 2019 | Population in 2024 |
|---|---|---|---|
| Choa Chu Kang Central | 0 | 2260 | 2910 |
| Choa Chu Kang North | 1 | 3080 | 4044 |
| Keat Hong | 1 | 2490 | 3590 |
| Peng Siang | 1 | 3650 | 4871 |
| Teck Whye | 2 | 3720 | 4599 |
| Yew Tee | 0 | 3630 | 4495 |
In Peng Siang, there is 1 elder-care facility to cater to the needs of 3650 elderly residents.
Teck Whye is the only subzone that contains 2 elder-care facilities. Hence, each facility caters to the needs of 1860 elderly residents living in the subzone. This number will increase to 2299 in 2024.
In Keat Hong, there is only 1 elder-care facility for the current population of 2490 residents aged 65 and above. However, the population of residents aged 65 and above is expected to increase to 3590 in 2024, which is an increase by 44% from the population in 2019.
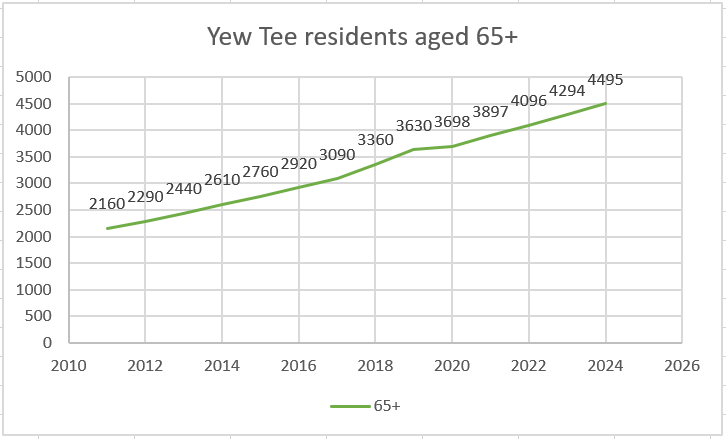
In Yew Tee, there are no elder-care facilities available to cater to the needs of the 3630 elderly residents. They would have to travel to the nearest facility located in CCK North. In 2024, the number of elderly residents is predicted to increase to 4495.
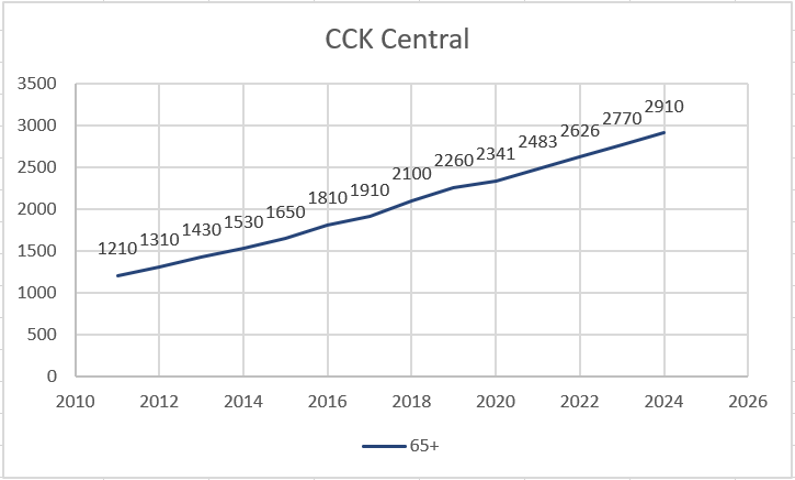
Similarly, there are no elder-care facilities available in CCK Central, which has a population of 2260 elderly residents. The nearest facility is located in the neighbouring subzone, CCK North and Teck Whye. The number of elderly residents in CCK Central is expected to increase to 2910 in 2024.
In CCK North, there are 3080 elderly residents and this number is predicted to increase to 4044 in 2024. Combined with the residents from other subzones that do not have any eldercare centres (Yew Tee and CCK Central), the only eldercare centre in CCK North will have to meet the needs of at least 8000 elderly residents.
Polyclinics
The table below highlights the number of polyclinics that can be found in each subzone in Choa Chu Kang.
| Subzone Name | Number of Polyclinics | Population in 2019 | Population in 2024 |
|---|---|---|---|
| Choa Chu Kang Central | 0 | 22230 | 22991 |
| Choa Chu Kang North | 0 | 32440 | 31304 |
| Keat Hong | 0 | 39198 | 56219 |
| Peng Siang | 0 | 33420 | 36000 |
| Teck Whye | 1 | 24720 | 23129 |
| Yew Tee | 0 | 40950 | 37756 |
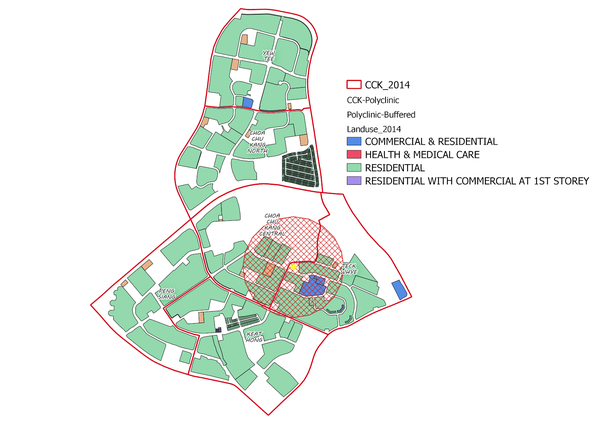
There is only 1 polyclinic in Choa Chu Kang, which can be found in the Teck Whye subzone, located in the east of Choa Chu Kang. This polyclinic caters to the needs of all 190,720 residents living in Choa Chu Kang. Residents not living in the Teck Whye subzone will have to travel to the polyclinic for appointments, and travelling time could range from 5 to 30 minutes.
Employment in Choa Chu Kang
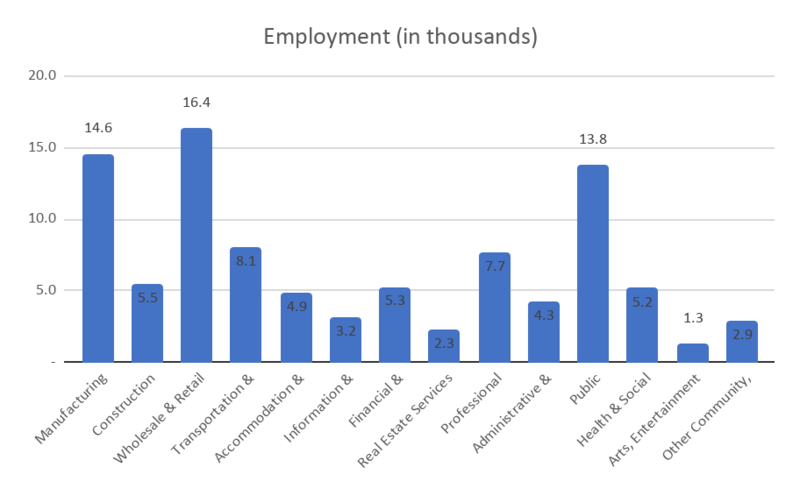
The graph displays the number of employed residents of Choa Chu Kang for the various sectors. The wholesale and retail sectors hold the highest number of employees compared to other sectors. Manufacturing, wholesale and public administration holds about 60% of the entire population jobs.
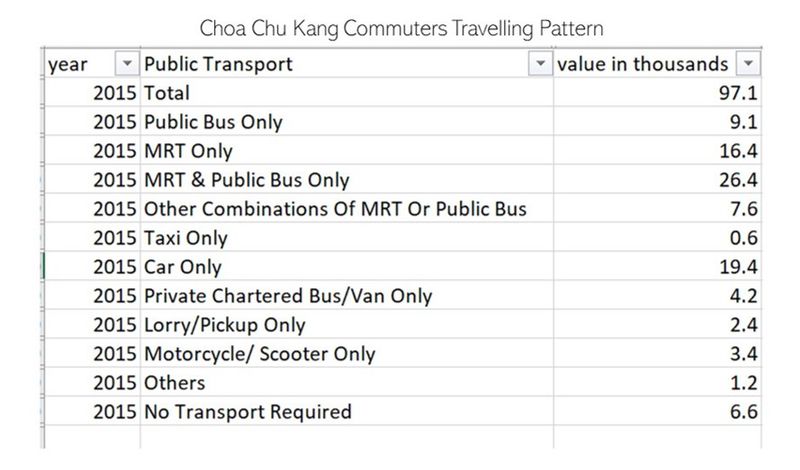
Analysis between Employment and commuters in CCK planning area The total number of commuters that uses MRT to get to work is 50400. Assuming that the total number of employed residents in Choa Chu Kang from 2015 to 2019 remains stagnant at 95500. This suggests that 52.7% of the employed residents take the MRT to work and this also tells us that more than 50% of the employed people in Choa Chu Kang area travel out for work and MRT is their main transport tool.
Analysis between Population growth and train capacity in CCK planning area There are currently 195 operating trains travelling on North-East Line. Given that each train can carry up to 1920 passengers, the total capacity of the train network on North-East Line is 374400. Furthermore, SMRT intends to increase its rolling stock with 6 train sets of CR151 by 2021 on North-East Line. The population of people aged 15 and above in CCK in 2019 is 162560 and is expected to increase to 179306 in 2024. After calculating, there is only an increase of 16,746 residents. The current capacity of MRT trains is still able to accommodate the growth of Choa Chu Kang population.
Task 3 Suggestions for Master Plan 2024
Vector-based Analysis
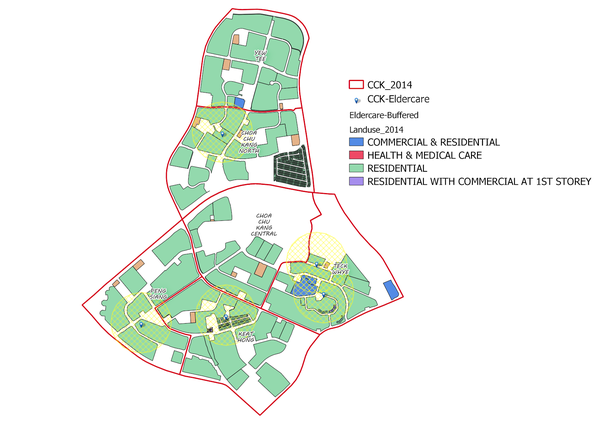
Buffer is used to mark a region around the indicators based on a specified distance. This will allow us to see the different amenities present within the radius of the specified distance. This is a map of Choa Chu Kang Planning Area by Landuse; From these buffer maps, we can see the various amenities (eg. HDB flats) that are within this area.
| Map | Description |
|---|---|
| This map indicates the exact locations of the various Eldercare centres located in Choa Chu Kang planning area. 300m buffers have been added around each Eldercare centre to highlight which buildings, facilities and roads are located within 300m of each centre. | |
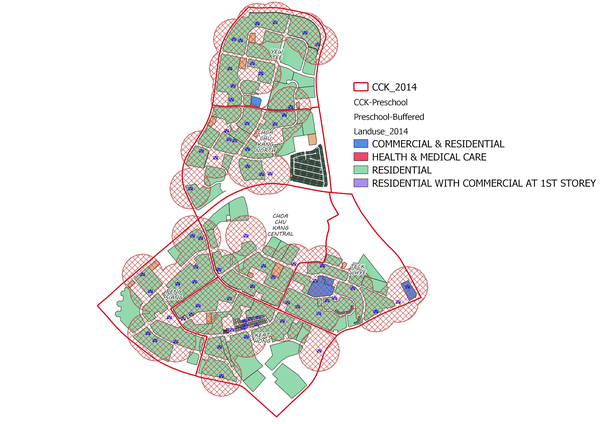
| This map indicates the exact locations of the various pre-schools located in Choa Chu Kang planning area. 200m buffers are added around each pre-school to highlight which buildings, facilities and roads are located within the 200m radius of each pre-school. | |
| This map indicates the exact locations of the only polyclinic located in Choa Chu Kang planning area. A 500m buffer has been added around the polyclinic to highlight which buildings, facilities and roads are located within a 500m radius of the polyclinic. The polyclinic is most accessible for residents living in CCK Central and Teck Whye. |
Trend Analysis
Build an additional eldercare centre in Yew Tee
According to the graph above that displayed the population for aged 60 and above in Yew Tee, we foresee that Yew Tee will be the third biggest subzone housing 4495 elderly. Compared to Peng Siang and Teck Whye, who have at least 1 eldercare to support the large group of elderly, there is no eldercare centre within Yew Tee currently. The elderly in Yew Tee will have to travel to CCK North if they want to visit the nearest eldercare centre. Furthermore, there will be 4044 elderly residents in CCK North by 2024, it might not be able to support the increase in the number of elderly residents in the long run. It is also inconvenient for the elderly to travel long distances. Therefore, we suggest building an eldercare centre at Yew Tee.
Build an additional eldercare centre in Choa Chu Kang Central
The population of elderly residents in Choa Chu Kang (CCK) Central is projected to increase further from 2260 in 2019 to 2910 in 2024. Currently, residents living in CCK Central have to travel to the nearest centres located in the neighbouring subzones, CCK North or Teck Whye. With our population predictions, the eldercare centre in CCK North will have to serve at least 8000 elderly residents in 2024. This is not ideal as the eldercare centre in CCK North may not be able to serve and meet the needs of the increase in the number of elderly residents.
Build an additional preschool as Keat Hong
Both Keat Hong and Peng Siang will experience an exponential increase in preschoolers population. In order to prioritise which subzone requires a new preschool more urgently, we compared the forecasted population for preschoolers in 2024. According to the graph below, we found out that Keat Hong will contain 5581 preschoolers aged 3 to 6 while Peng Siang only consists of 1897 preschoolers. Keat Hong has significantly more preschoolers than Peng Siang. In the coming 2024, the current 16 preschools in Keat Hong will have to increase their ratio to 348 preschoolers per preschool. Therefore, we suggest building a preschool at Keat Hong.
Build an additional polyclinic
Currently, there is only one polyclinic that is situated near the boundary of Teck Whye and Choa Chu Kang Central. https://www.nhgp.com.sg/uploadedFiles/About_Us/NHGP_AR_PDF.pdf
According to the following website, it stated that every polyclinic holds about 272,300 attendances. Given that the forecasted population of Choa Chu Kang in 2024 is 205,498. The current polyclinic is still able to accommodate the entire population of Choa Chu Kang for the next 5 years. Therefore, there is no urgent need to build a new polyclinic by 2024. Furthermore, Choa Chu Kang also has various other medical services available for its residents, such as CHAS clinics.
Steps taken to Identify New Facility Placement
Step 1: Assumptions
Assumptions and criteria
Assumption 1: The majority (90%) of residents in Choa Chu Kang do not own private transport
Assumption 2: All residents in CCK live within 300m of a bus stop
Step 2: Decision Factors
The 3 decision factors that are particularly relevant have been identified
1. Accessibility Factor (Roads):
The selected site should be close to local roads to ensure easy transportation of building materials during the construction stage. The roads are shown in a line vector, and are categorized into cycleway, footway, primary roads, residential, secondary roads and service roads. The service roads spread across most of the Yew Tee and Choa Chu Kang Central planning area, whereas the other tracks are located around the subzones connecting to other roads in the South of Choa Chu Kang.
2. Accessibility Factor (Bus-stops):
The selected site should be close to the residential area to make movement as little as possible for the elderlies. Some bus stops have been identified from the map that there are some loup bus routes. All bus stops are treated as most used indicator in a form of transportation. Hence the selected land lot should be near to the bus stops as possible.
3. Economic Factor (Elevation):
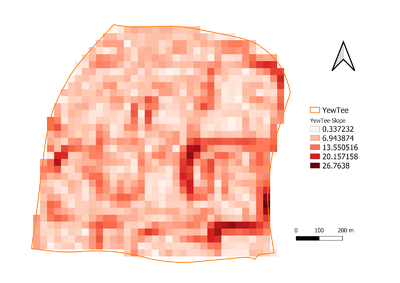
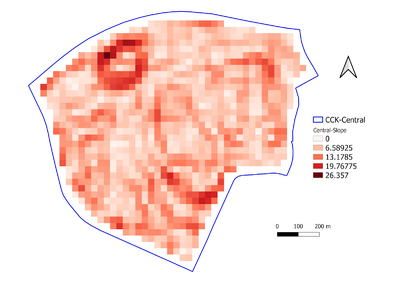
Lastly, the selected land lot should avoid steep slopes to reduce the development costs for cut-and-fill construction techniques. The lowest point in Yew Tee is 0.337232 meters above sea level; Choa Chu Kang Central is 0 meters above sea level is depicted in light orange. The overall highest elevation with 27 meters above sea level is depicted in dark orange. Only around 2% of the bus stops and 6-8% of the local roads in Yew Tee and 1% of the bus stops and 8% of the local roads in Choa Chu Kang Central are located in the region with the highest elevation.
Raster-based analysis can only be done on raster layers. Hence, we conducted raster-based analysis on the indicators that we rasterized. Next, is using the raster layers to approximate the layers according to each factor of interest.
Step 3:Proximity Map
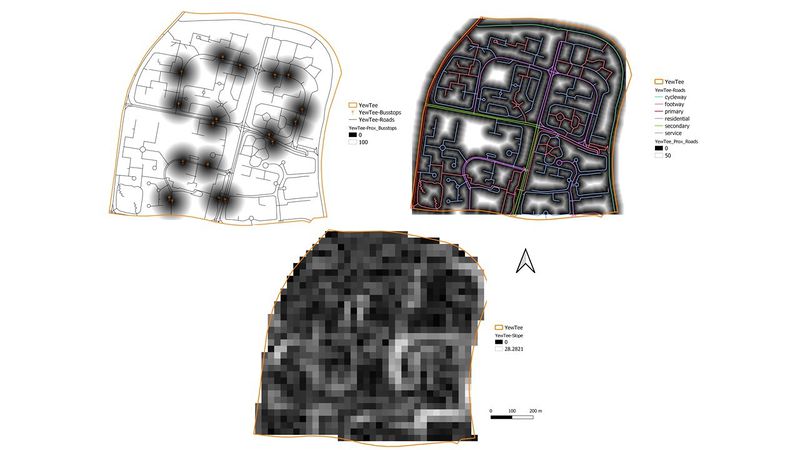
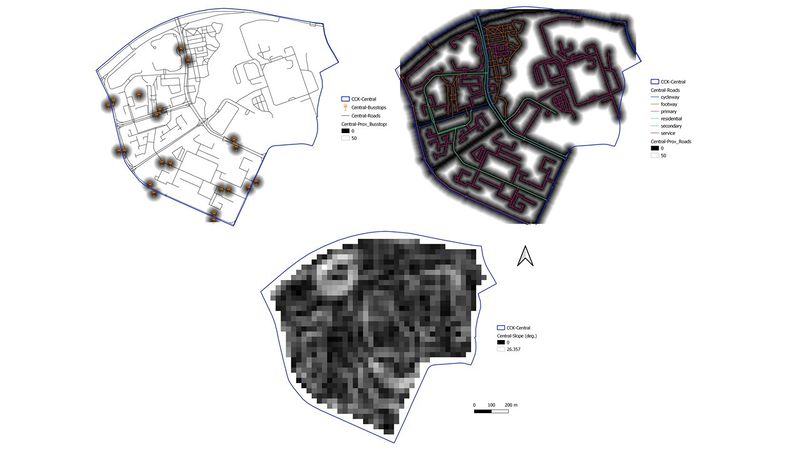
To select a suitable land lot, a proximity analysis is needed to show the closeness of all the nearby land lots in the specific subzones to the identified features of interest. In general, darker values in the maps below depict higher closeness to the features of interest, and lighter values depict lower closeness.
For the purpose of this analysis, only the features of interest located within Yew Tee and Choa Chu Kang North Planning Area are recognized such as bus stops and roads located around each subzone. Outside of the planning subzone boundaries defined by URA should be taken into consideration as well. Hence, this might cause the analysis results to be different to a certain extent.
Eldercare centre 1 - Yew Tee
Proximity to Bus stops
Darker values depict higher suitability of land lot in the accessibility factor. The distance from a 5 meters by 5 meters land lot to the nearest road within Yew Tee is 0 meters, and the furthest distance is 255.442 meters. In the map above, all land lots with distance to the nearest bus stop of at least 50 meters are shown in white.
Proximity to Roads
Darker values depict a higher suitability of land lot in the accessibility factor. The distance from a 5 meters by 5 meters land lot to the nearest bus stop within Yew Tee is 0 meters, and the furthest distance is 476.34 meters. In the map above, all land lots with distance to the nearest road of at least 100 meters are shown in white.
Slope Analysis
Slopes are calculated using proximity to elevation. Land lots with darker values have flatter surfaces, and thus they have higher suitability to build the eldercare centre. The minimum steepness of a 30 meters by 30 meters land lot is 0 degrees, which indicates flat land; while the maximum steepness is approximately 28.29 degrees. As seen from the map, most of the land lots in Yew Tee are flat.
Eldercare centre 2 - Choa Chu Kang Central
Proximity to Bus stops
Darker values depict higher suitability of land lot in the accessibility factor. The distance from a 5 meters by 5 meters land lot to the nearest road within Choa Chu Kang Central is 0 meters, and the furthest distance is 871.22 meters. In the map above, all land lots with distance to the nearest bus stop of at least 50 meters are shown in white.
Proximity to Roads
Darker values depict higher suitability of land lot in the accessibility factor. The distance from a 5 meters by 5 meters land lot to the nearest bus stop within Choa Chu Kang Central is 0 meters, and the furthest distance is 504.232 meters. In the map above, all land lots with distance to the nearest road of at least 50 meters are shown in white.
Slope Analysis
Slopes are calculated using proximity to elevation. Land lots with darker values have flatter surfaces, and thus they have higher suitability to build the eldercare centre. The minimum steepness of a 30 meters by 30 meters land lot is 0 degrees, which indicates flat land; while the maximum steepness is approximately 26.36 degrees. As seen from the map, most of the land lots in Choa Chu Kang Central are flat.
Step 4:Criterion Scores on the 3 Decision Factors
Standardised Criterion score to build Eldercare Centres
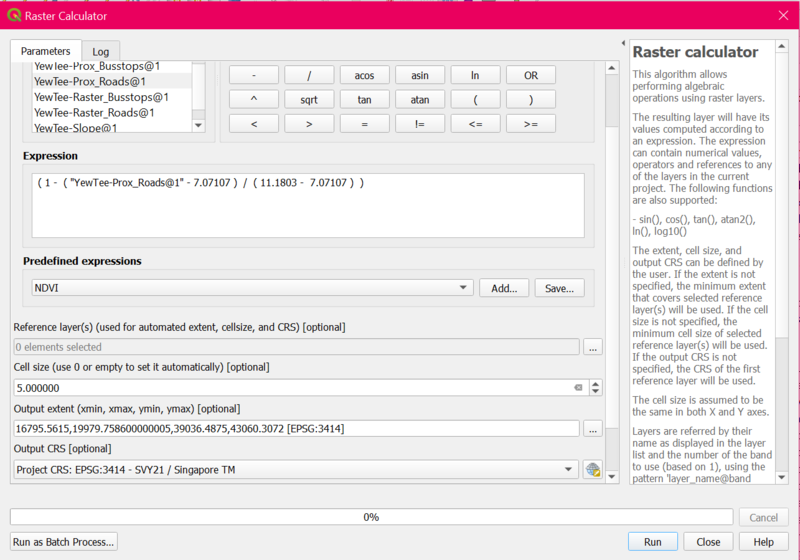
To calculate which plots of land are most suitable for building the Eldercare Centre, we have to standardise the proximity analysis results using the following formula:
Standardised Results = [Proximity to Features - Min(Proximity to Features)] / [Max(Proximity to Features) - Min(Proximity to Features)]
After obtaining the standardised scores, we calculated the criterion scores using the following methods:
| Factors | Criterion Scores |
|---|---|
| Accessibility | 1 - Standardised Results of Proximity to Roads |
| Accessibility | 1 - Standardised Results of Proximity to Bus Stops |
| Slope | 1 - Standardised Results of Slope Analysis |
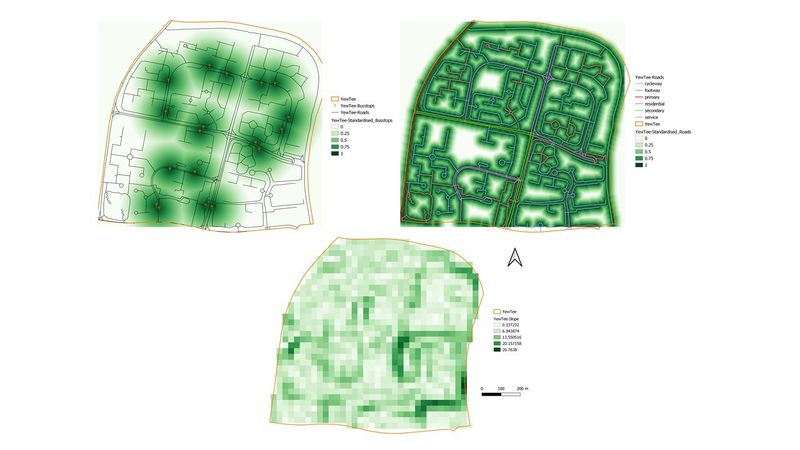
Eldercare centre 1 - Yew Tee
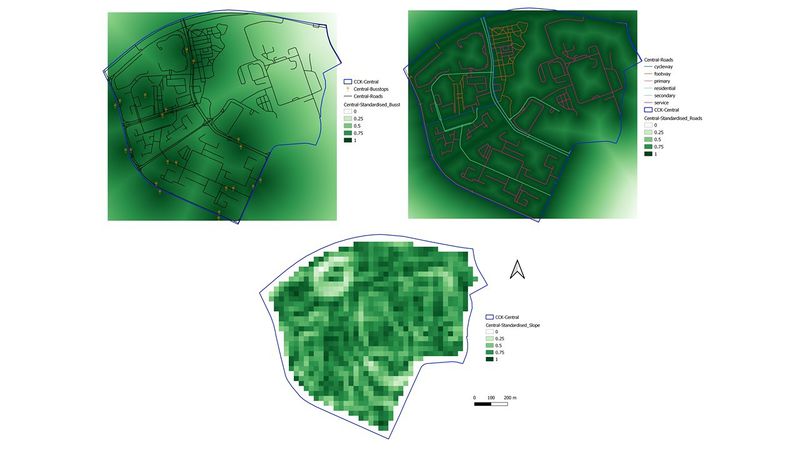
Eldercare centre 2 - Choa Chu Kang Central
Accessibility Score for Bus Stops and Roads
The accessibility score is calculated with "1 - Standardised Results of Proximity to Roads / Standardised Results of Proximity to Bus Stops ". After standardisation, the land lots that are further away from the local roads and bus stops within Choa Chu Kang Central and Yew Tee have higher standardised units. There is a need to deduct the standardised results from 1 to obtain the criterion score for the accessibility factor as the land lots that are further away from local roads and bus stops should get a lower score, and those nearer to local roads and bus stops should get a higher score.
Economic Score
The score for economic factor is calculated with "1 - Standardised Results of Slope Analysis". The land lots that have steeper slopes within Choa Chu Kang Central and Yew Tee have higher standardised units as they have higher degrees of steepness. Thus, the standardised results are inverted. They are deducted from 1 to obtain the criterion score for the economic factor. This is because a gentler slope is preferred in the economic factor and a steeper slope is less desired, as mentioned before.
Step 5: AHP for both Eldercare centres
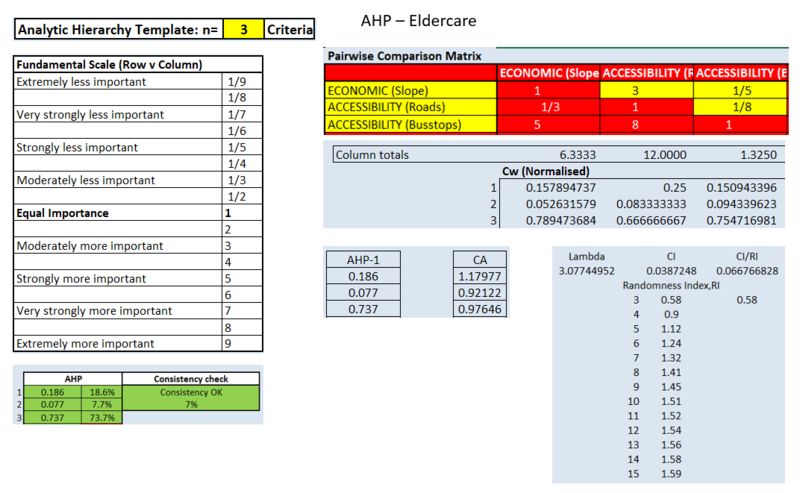
Note: The AHP report is generated using the AHP template from SCBUK and cropped to show only relevant parts of the report for neatness.
The AHP input matrix and result report is generated to calculate the relative importance of each factor. The relative importance of each factor is determined by the AHP score, as seen in the green cells in the image above. A higher AHP score translates to a higher relative importance for that factor. The input of the Pairwise Comparison Matrix is determined by the perceived importance of each factor relative to another factor. For example, as compared to accessibility for bus stops factor, economic factor is strongly less important. However, when compared to accessibility for roads factor, economic factor is moderately more important. The final results show that the most important factor is accessibility for bus stops factor (0.737), followed by economic factor (0.186) and accessibility for roads factor (0.077).
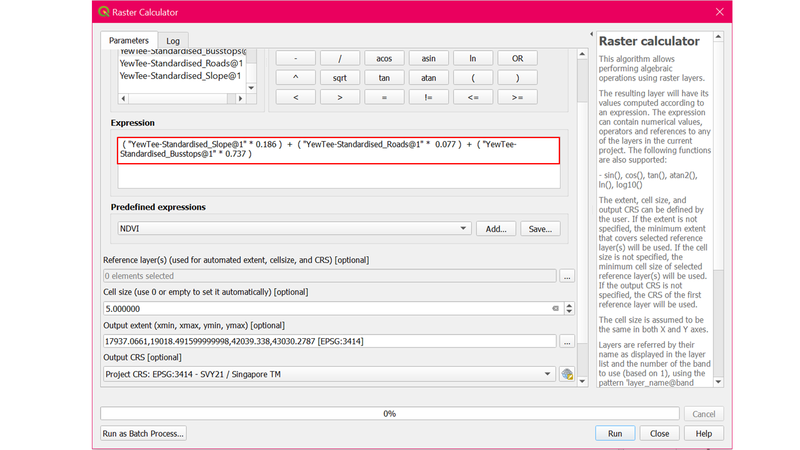
These AHP scores serve as weights to determine the final suitability score of each land lot within the subzones chosen to build the eldercare centres.
The consistency is at 7%, which is below 10%. This indicates that the inconsistency generated by the pairwise comparison matrix is still within the acceptable range.
Step 6: Suitable Land Lots Identified
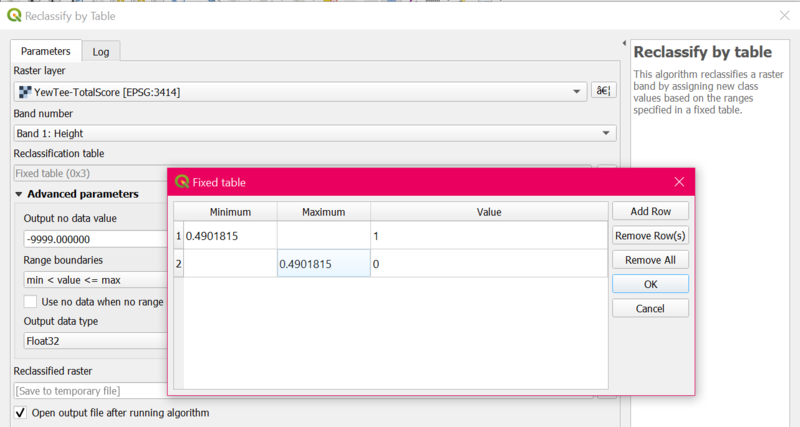
The land lot suitability is calculated using the formula shown above. However, the score wasn't intuitive enough. To get a finalised suitable land lot from the Total scores, the min and max will be calculated by using the Reclassification by Table.
Step 7: Composite Analysis
Eldercare centre in Yew Tee
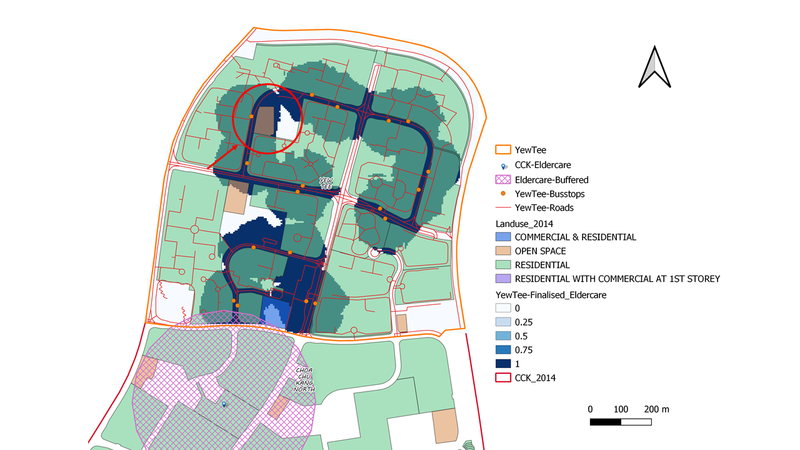
Currently, there are 2 areas of Open Space in Yew Tee that are unused. After calculating the final score with the help of the AHP Matrix, we have derived the Suitability landlots layer. With further analysis, we have decided to gazette the smaller area of open space (as indicated in the image above) located nearer to the North of Yew Tee for the construction of the new Eldercare centre.
With a 300m buffer around the nearest eldercare centre in CCK North, the residents living nearer to the south of the Yew Tee subzone will still be able to easily travel to the CCK North eldercare centre. Based on our QGIS analysis, the Open Space is also located on a darker area on the YewTee-Finalised_Eldercare layer which indicates that the land is more suitable for construction of the new centre based on our criteria as stated above.
Thus, building a new eldercare centre at the North of Yew Tee will increase its accessibility for Yew Tee residents living in the north as they do not need to travel long distances to get to the eldercare centre in CCK North, which can be inconvenient for the older generation. This new eldercare centre will also be able to meet the needs of the increasing population of elderly in the subzone.
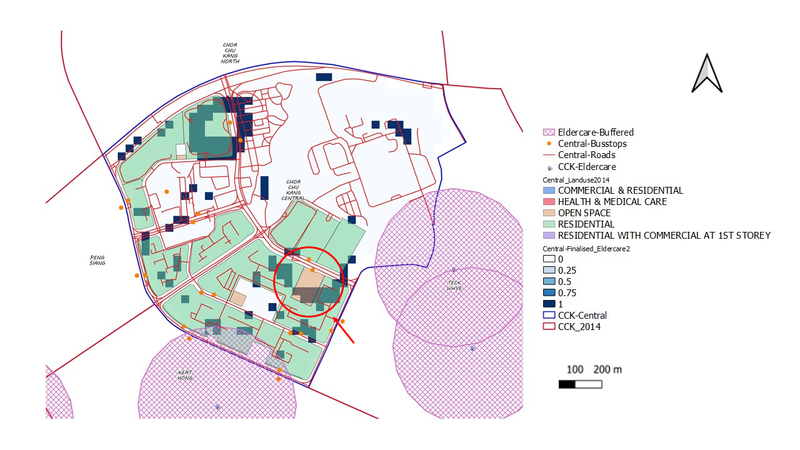
Eldercare centre in Choa Chu Kang Central
Currently, there are no eldercare centres located in Choa Chu Kang (CCK) Central. The nearest eldercare centres are located in Teck Whye and CCK North subzones. The number of elderly residents in CCK Central is expected to increase to 2910 in 2024. By then, the CCK North eldercare centre would have to serve at least 8000 elderly residents based on the projected population numbers as residents from CCK Central would have to travel there.
After further analysis, there are multiple Open Spaces located in CCK Central that are suitable for the construction of the new eldercare centre. We have decided on the Open Space as indicated in the map above for the location of the new eldercare centre as it as a large area of 10654m2 and is located at the south of CCK Central.
Furthermore, based on our QGIS analysis, the Open Space is located near the dark red region which indicates that the area is more suitable for the new eldercare centre. Building a new centre at this location will increase its accessibility for residents living in CCK Central as they do not need to travel long distances to get to the nearest eldercare centre, which can be inconvenient for the older generation. The new centre is also located right next to a bus stop. This new eldercare centre will also be able to meet the needs of the increasing population of elderly in the subzone.
Pre-school in Keat Hong
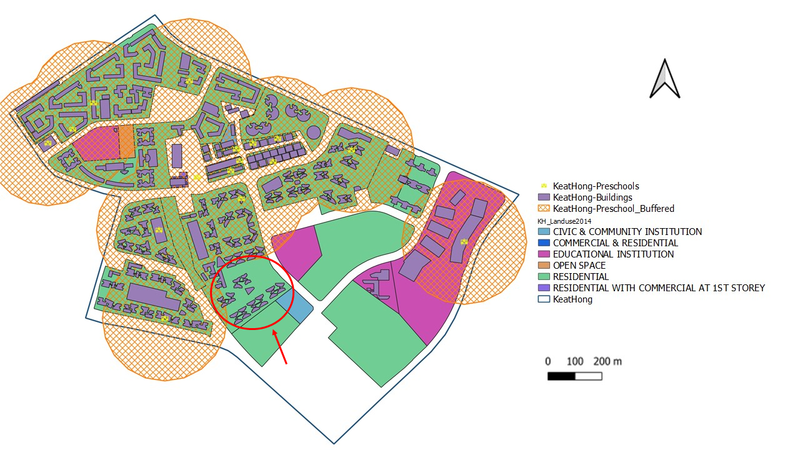
Currently, existing pre-schools in Keat Hong are mostly located at the ground floor of various Housing Development Board (HDB) flats. This is to ensure that working parents are able to easily drop off and pick up their young children as it is located near their homes. It also provides ease of access for the young childrens’ caretakers. Hence, we decided that building a new pre-school at the ground floor of a residential block located at the south of the subzone.
Referring to the map above, there is a buffer around each of the pre-schools in Keat Hong. We used a buffer of 200m as we believe that 200m is a suitable walking or travelling distance for young children and their parents or caretakers. The 200m buffers around existing pre-schools in the subzone also do not cover the area that we have chosen for the new pre-school. Furthermore, residential blocks are not located near many primary roads for the safety of the children. With the addition of the new pre-school in Keat Hong, residents living in residential areas will not have to travel up to 800m in order to get to the nearest pre-school. The ratio of young children to pre-schools in 2024 will also decrease to 165 children per pre-school.
Conclusion
With the different indicators that was being used, we are able to visualise the potential improvements of living in Choa Chu Kang districts in the form of geospatial perspective. Through the use of QGIS, we could analyse the problem of the issue such as location of convenience buildings and facilities that are not very accessible to different groups of residents. Overall, our team hopes to inspire a deeper analysis in the use of QGIS even for future use.
Acknowledgement
Thank you to Prof Kam for your guidance and patience. You have provided us with an endless amount of valuable information and insights on QGIS and we will treasure the knowledge we have gained.
References
Page 24 https://www.nhgp.com.sg/uploadedFiles/About_Us/NHGP_AR_PDF.pdf
(Wikipedia, n.d.) https://en.wikipedia.org/wiki/Choa_Chu_Kang
5 Years Master Plan http://www.ccktc.org.sg/our-town/5-year-master-plan/

