IS428 AY2019-20T1 Assign Chye Soon Hang Observations
Contents
- 1 Q1: Visualize radiation measurements over time from both static and mobile sensors to identify areas where radiation over background is detected. Characterize changes over time.
- 2 Q2. Use visual analytics to represent and analyze uncertainty in the measurement of radiation across the city.
- 2.1 a. Compare uncertainty of the static sensors to the mobile sensors. What anomalies can you see? Are there sensors that are too uncertain to trust?
- 2.2 b. Which regions of the city have greater uncertainty of radiation measurement? Use visual analytics to explain your rationale.
- 2.3 c. What effects do you see in the sensor readings after the earthquake and other major events? What effect do these events have on uncertainty?
Q1: Visualize radiation measurements over time from both static and mobile sensors to identify areas where radiation over background is detected. Characterize changes over time.
Based on the visualization above, we can clearly see that the fluctuations of sensor readings only started after the earthquake happened on Apr 8, 1:56pm. The reading started to rise at the nuclear plant. Subsequently, by Apr 8, 4:30pm, the radiation outspread have reached more towns, which can be seen in the darken shadings of the various towns around Safe Town. Therefore, users can easily identify how fast the contamination has been spread.
There were also places with low average readings, but sensors have high spikes before. Hence, such places are of high concerns as well.
Q2. Use visual analytics to represent and analyze uncertainty in the measurement of radiation across the city.
a. Compare uncertainty of the static sensors to the mobile sensors. What anomalies can you see? Are there sensors that are too uncertain to trust?
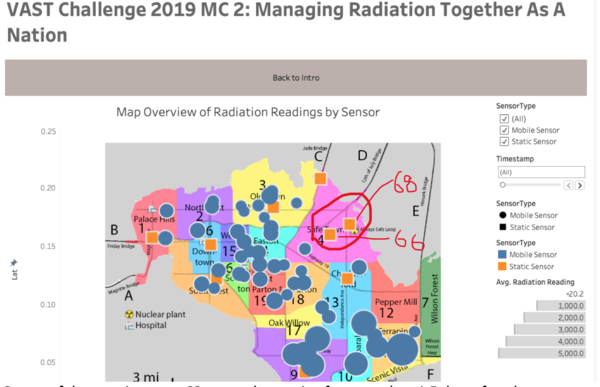
Based on the visualization showing static sensors, the strange part of the data is that when the earthquake happened, sensors like 66 and 68 which are right in the vicinity of the nuclear plant, did not report high readings and that is highly suspicious.
On top of that, static sensor 68 stopped reporting for more than 1.5 days after the earthquake happened. This might imply that the sensor might have broken down during the incident and missed out on capturing important information for us to understand about the situation.
This situation happens with the mobile sensors as well as shown in the screenshot above, with multiple sensors not reporting for quite a long period of time.
Such scenario makes the dataset less credible in helping us to identify the true root cause or underlying problem in the entire incident.
b. Which regions of the city have greater uncertainty of radiation measurement? Use visual analytics to explain your rationale.
From this visualization, you can see that Old Town presents a huge uncertainty due to the sudden spike. Despite having normal average, this spike still creates a doubt to users as to what caused the spike. Hence, regulatory should prioritize this area.
c. What effects do you see in the sensor readings after the earthquake and other major events? What effect do these events have on uncertainty?
As mentioned earlier, some of the sensors stopped reporting data after the earthquake. This could have blindsided our analysis as that period could have presented critical information of the radiation which we failed to capture.


