IS428 AY2019-20T1 Assign Chye Soon Hang Data Cleaning
Revision as of 12:33, 13 October 2019 by Shchye.2017 (talk | contribs)
Data Cleaning
This dashboard is supported by the following 4 datasets, given in CSV and SHP formats:
- StaticSensorLocations.csv – contains locations of the static sensors
- StaticSensorReadings.csv – contains readings from 9 static sensors that are situated either around hospitals if not somewhere near to Always Safe Nuclear Power Plant
- MobileSensorReadings.csv - contains readings from 50 mobile sensors that are attached to cars
- StHimark.shp – contains geometry and sensor id for individual neighborhood
Data Transformation on Tableau Prep
- Import all CSV files on to Tableau Prep
- Join StaticSensorLocations.csv and StaticSensorReadings.csv via the Join function
- Set Join type to be Inner Join and Join Clause to be matching Sensor-id
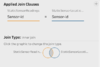
- This will help to give each static sensor record its respective locations (Long, Lat)
- Due to conflicting sensor ids with mobile sensors, I have change all the static sensor id to start from 60 to 68.
