IS428 AY2019-20T1 Assign Foo Yong Long Data Transformation
|
|
|
|
|
|
|
MC2 contains data of the Mobile and Static Sensors which display radiation levels in Counts Per Minute(CPM) that supports the entire length of the simulation(6th April 2020,0000Hrs - 10th April 2020,2359Hrs). The data cleaning process is as follow:
Data Preparation
To ensure a thorough analysis of the data, the values and locations of both Mobile and Static sensor categories have to be analyzed together. I have created two excel files labeled "HospitalLocations.csv" and "AlwaysSafe.csv" as shown below. This data will be utilized for distance calculation and to create a more interactive dashboard for the end-user.
Longitude and Latitude of Hospital Locations
Longitude and Latitude of Always Safe Plant
The data preparation was entirely done in Tableau Prep Builder. The final flow is as follow:
| Step | Description |
|---|---|
|
1 |
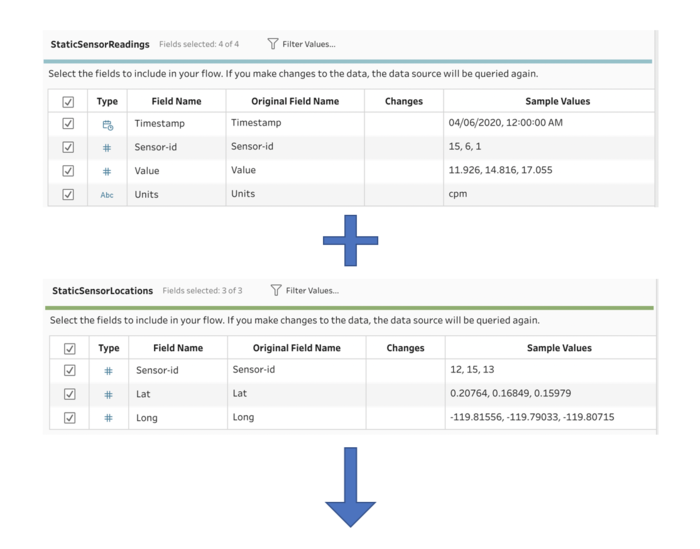
The static sensor data consist of two files. One of the files contains the longitudes and latitudes of the Sensors while the other file contains the timestamp of the sensors. Both files were combined utilizing an inner join by matching their Sensor IDs. |
|
2 |
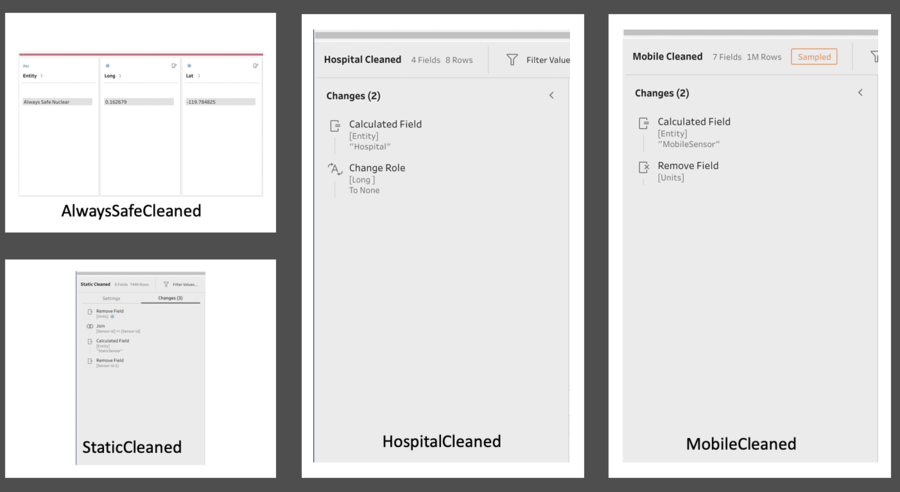
The column "Value" was removed from both the sensors file as it is redundant. A column "Entity" was created for all data to identify the respective data points." "MobileSensor" value in column "Entity" represents the data points belonging to mobile sensors. "StaticSensor" value in column "Entity" represents the data points belonging to static sensors. "Hospital" value in column "Entity" represents the data points belonging to hospitals. "Always Safe Nuclear" value in column "Entity" represents the data points belonging to Always Safe nuclear plant. These were used to differentiate the data points when combing the various data into one single data table which will be explained later. |
|
3 |
Sensor-ids repeat between the mobile and static sensors. To differentiate them, make a new calculated field that labels all static sensor data as "Static". The New Sensor-id contains the prefix "S" to signify that this is a static sensor. The "Units" field is not required as the measurements(cpm) are standard between the static and mobile data. |
|
4 |
Now that the data has the same format and columns, we can union the static and mobile sensor data. |
|
5 |
The final data file is as above. The data is output as an extract to optimise performance when imported into Tableau. |
Importing data into Tableau
| Step | Description |
|---|---|
|
1 |
In order to be able to aggregate data by neighbourhood, we will have to make use of the shape file provided. To join the data with the polygons from the shape file, we can use a formula to assign the coordinates of the sensor to a specific polygon(neighbourhood). |


