IS428 AY2019-20T1 Assign Sin Myeong Eun
|
|
|
|
Problem & Motivation
St Himark’s Always Safe nuclear power plant is a major power provider in St Himark, with approximately 72% of its power being supported by Always Safe. Due to the recent earthquake, the nuclear power plant has been damaged on a moderate level, thus resulting in a certain extent of contamination. Moreover, the employees who work for Always Safe unfortunately faced the issue of their cars being contaminated by coolant leak. Based on the data from citizen-operated mobile sensors and government-operated stationary sensors, a new visualisation platform is to be created for St. Himark’s emergency management team to gain deeper insight regarding the varying conditions across the city, as well as identify the regions that they would have to pay more attention to.
Data preparation
1. Merging StaticSensorReadings.csv & StaticSensorLocations.csv
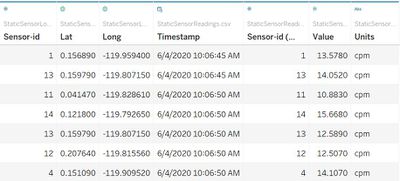
The merging of the two csv files was the very first step that was taken, because StaticSensorReadings only show us the radiation value that each sensor was able to detect, without knowledge of where the sensor is located at. This step was done on tableau itself, by doing an innerjoin of the two files as shown in the figure below. The sensor IDs were used to match the rows in the files.
When the first step is done properly, tableau would show the output dataset as shown below:
2. Combining StHimark.shp & MobileSensorReadings.csv
MobileSensorReadings.csv alone does not give us much insight as to how the mobile sensors are moving around St.Himark because their locations are only given to us as latitude and longitude fields. It would make more sense for us to study the radiation recordings with the locations of the neighbourhoods clearly shown in a map format. This was done by doing an innerjoin between Geometry of the shape file and MAKEPOINT([Lat],[Long]). The MAKEPOINT() function allows us to format the non-spatial attributes like latitude and longitude into a spatial attribute.
When the second step has been done correctly, tableau will show the output dataset as shown below:


