IS428 AY2019-20T1 Assign Greg Tan Boon Kit Interactive Dashboard
Revision as of 01:55, 13 October 2019 by Greg.tan.2017 (talk | contribs)
|
|
|
|
|
|
| Technique | Rationale & Implementation |
|---|---|
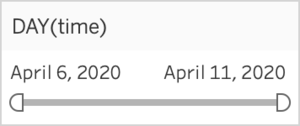
| Interactive Technique 1: Filter for the use of time range slider | Adding a filter option allows the person using the dashboard to instantly narrow down the dates that he/she wishes to focus on. Employing the use of a slider also allows the user to specify a range of dates that he/she might wish to analyse. This works best with the date option as analysing a range of dates might allow the user to discover new insights.
From a usability standpoint, having a slider allows the user to easily select the range of the time period wanted. This step is easier than using a checkbox/list, which requires multiple unnecessary clicks to achieve the same effect. Implementation: To achieve this slider filter function, simply do the following steps:
|

