Difference between revisions of "Cakrawala"
| Line 211: | Line 211: | ||
<br/> | <br/> | ||
==<div style="background:#f67c6c; padding: 15px; font-weight: bold; line-height: 0.3em; letter-spacing:0.5em;font-size:20px"><font color=#fff face="Century Gothic"><center>CONSIDERATION & VISUAL SELECTION</center></font></div>== | ==<div style="background:#f67c6c; padding: 15px; font-weight: bold; line-height: 0.3em; letter-spacing:0.5em;font-size:20px"><font color=#fff face="Century Gothic"><center>CONSIDERATION & VISUAL SELECTION</center></font></div>== | ||
| + | <br/> | ||
| + | Below are a few visualizations and charts we considered making for our projects. | ||
| + | <center> | ||
| + | {| class="wikitable" style="background-color:#FFFFFF;" width="90%" | ||
| + | |- | ||
| + | ! style="font-weight: bold;background: #141414;color:#fbfcfd;width: 45%;" | Visual Considerations | ||
| + | ! style="font-weight: bold;background: #141414;color:#fbfcfd;width: 55%" | Insights / Comments | ||
| + | |- | ||
| + | | <center> | ||
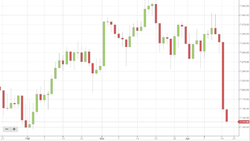
| + | '''Title''': Candlestick Graph | ||
| + | [[File:Cakrawala_ConsiderationVisual1.png|250px|frameless|center]] | ||
| + | '''Source''': https://thestophunter.co.uk/technical-analysis-candlestick-charts/ | ||
| + | </center> | ||
| + | |||
| + | || | ||
| + | '''Show the price movement at given instrument''' | ||
| + | *'''Pros:''' | ||
| + | ** Can be used in describing the trade balance (export-import) of Indonesia | ||
| + | ** With color-coding can easily point out of the possible earning / losses | ||
| + | |||
| + | *'''Cons:''' | ||
| + | ** Need a minimum number of data to work with (e.g. must have Open/Close, High/Low data to work). | ||
| + | |- | ||
| + | |||
| + | | <center> | ||
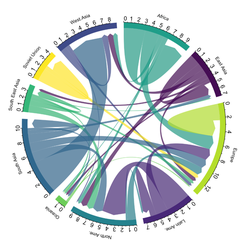
| + | '''Title''': Chord Graph | ||
| + | [[File:Cakrawala_ConsiderationVisual2.png|250px|frameless|center]] | ||
| + | '''Source''': https://www.data-to-viz.com/graph/chord.html | ||
| + | </center> | ||
| + | |||
| + | || | ||
| + | '''Shows flows / connection between several entities''' | ||
| + | *'''Pros:''' | ||
| + | ** Aim to show the import and export of Indonesia | ||
| + | ** With highlighting, we will be able to spot them in and outflow of Indonesia’s Trade | ||
| + | |||
| + | *'''Cons:''' | ||
| + | ** Over-cluttering makes figure unreadable (too many data / country) | ||
| + | ** Hard to discover the pattern | ||
| + | |- | ||
| + | |||
| + | | <center> | ||
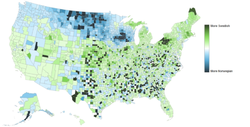
| + | '''Title''': Choropleth Map | ||
| + | [[File:Cakrawala_ConsiderationVisual3.png|250px|frameless|center]] | ||
| + | '''Source''': https://viscomvibz.wordpress.com/2012/03/17/the-pros-cons-of-choropleth-maps-blot-maps-patch-maps/ | ||
| + | </center> | ||
| + | |||
| + | || | ||
| + | '''Using coloring scheme to show the value levels''' | ||
| + | *'''Pros:''' | ||
| + | ** Can effectively show the reported country that works with Indonesia through the shaded area. | ||
| + | ** Can detect the relationship between the encoded variable and geographic location. | ||
| + | |||
| + | *'''Cons:''' | ||
| + | ** Choropleth map used average value to represent the area so the user might not able to access detail information. | ||
| + | ** Area is not uniform so that it might misleading between the area on map and the value levels represented. | ||
| + | |- | ||
| + | |||
| + | | <center> | ||
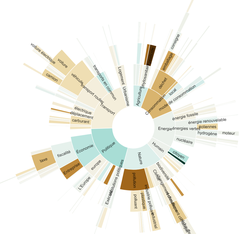
| + | '''Title''': Sunburst Graph | ||
| + | [[File:Cakrawala_ConsiderationVisual4.png|250px|frameless|center]] | ||
| + | '''Source''': https://observablehq.com/@julesbonnard/sunburst | ||
| + | </center> | ||
| + | |||
| + | || | ||
| + | '''Display the hierarchical data in circular format''' | ||
| + | *'''Pros:''' | ||
| + | ** Can visualize the hierarchical of import and export items based on the amount | ||
| + | ** Can visualize the breakdown between oil & gas and non-oil & gas | ||
| + | |||
| + | *'''Cons:''' | ||
| + | ** Cannot clearly define which is belong to oil & gas and non-oil & gas | ||
| + | ** Too many breakdowns make it hard to identify the details clearly | ||
| + | |} | ||
| + | </center> | ||
| + | <br> | ||
| + | <br/> | ||
| + | ==<div style="background:#f67c6c; padding: 15px; font-weight: bold; line-height: 0.3em; letter-spacing:0.5em;font-size:20px"><font color=#fff face="Century Gothic"><center>BRAINSTORMING SESSION</center></font></div>== | ||
<br/> | <br/> | ||
Revision as of 23:05, 6 October 2019
<--- Go Back to Project Groups
Contents
PROBLEM & MOTIVATION
The Ministry of Trade (Kementrian Perdagangan Republik Indonesia) and Central Agency of Statistics (Badan Pusat Statistik) of Indonesia has been providing comprehensive Indonesia’s trading data. However, the information is mostly displayed in a table format. Hence, it is challenging to derive analysis and insights.
Our motivation is to address lack of a comprehensive visualization platform to show the impact of export and import on indonesia’s trade of balance. Furthermore, through this platform, users can essentially identify areas of deficit and improvement on the available data that Indonesia can work on.
It is important to do so because Indonesia is the 4th largest country in the world and one of the largest consumption markets at the global level. Export also has been the engine of Indonesia economy yet it has been declining steadily in 2012 due to lower commodity price and dwindling global demand. Moreover, now in 2019, Indonesia’s export has dropped by 9.99 percent as compared to 2018.
OBJECTIVE
From the comprehensive datasets readily available in the Central Agency of Statistics (over 85 data sets), we will focus on the 3 main objectives. It is as follows:
- Gain overall insights on the Export and Import activities in Indonesia by countries and regions since 2002. We will also identify the top trading partner of Indonesia.
- Identify the yearly trends of Exported and Imported Oil and Gas and Non Oil and Gas in Indonesia by countries. This would give us a better understanding on potential type of goods that Indonesia could focus on.
- Gain insights on the yearly trade balance trends to identify potential trading opportunity for Indonesia.
SELECTIVE DATABASE
The Data Sets we will be using for our analysis and for our application is listed below:
| Dataset/Source | Data Attributes | Rationale Of Usage |
|---|---|---|
(1996 - 2019, July) |
|
|
Value of Exports by Major Countries of Destination (FOB value:million US$), 2000-2017
Value of Imports by Major Countries of Origin (CIF value: million US$), 2000-2017 |
|
|
Value of Exports by Major Ports (FOB value: million US$), 2000-2017
Value of Imports by Major Ports (CIF value: million US$), 2000-2017 |
|
|
Volume and Value of Indonesia Import and Export per Commodity
|
|
|
BACKGROUND SURVEY
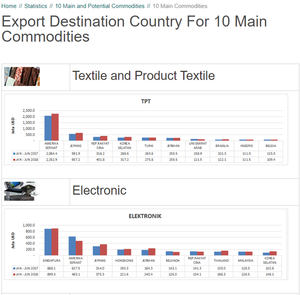
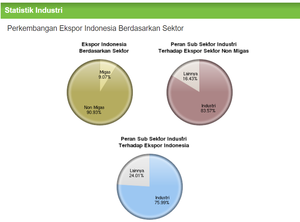
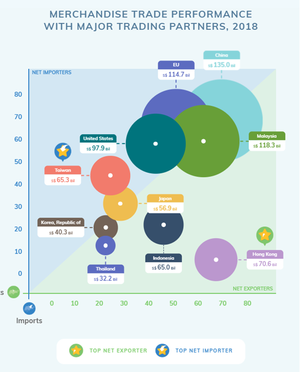
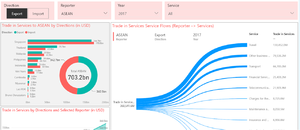
We did basic background research on some existing visualizations or dashboards we could drive inspirations from or make it better. Below are a few visuals we found:
| Reference of Other Interactive Visualization | Learning Point |
|---|---|
Title: Export Destination Country For 10 Main Commodities
|
Positive Points:
Negative Points:
|
Title: Indonesia Growth of Export by Sector
|
Positive Points:
Negative Points:
|
Title: Marchendise Trade Performance
|
Positive Points:
Negative Points:
|
Title: ASEAN's Stat |
Positive Points:
|
CONSIDERATION & VISUAL SELECTION
Below are a few visualizations and charts we considered making for our projects.
| Visual Considerations | Insights / Comments |
|---|---|
Title: Candlestick Graph Source: https://thestophunter.co.uk/technical-analysis-candlestick-charts/ |
Show the price movement at given instrument
|
Title: Chord Graph |
Shows flows / connection between several entities
|
Title: Choropleth Map Source: https://viscomvibz.wordpress.com/2012/03/17/the-pros-cons-of-choropleth-maps-blot-maps-patch-maps/ |
Using coloring scheme to show the value levels
|
Title: Sunburst Graph |
Display the hierarchical data in circular format
|
BRAINSTORMING SESSION

