Difference between revisions of "IS428 AY2019-20T1 Assign Lee Cheng Leng EDA"
Jump to navigation
Jump to search
Cllee.2017 (talk | contribs) |
Cllee.2017 (talk | contribs) |
||
| (5 intermediate revisions by the same user not shown) | |||
| Line 24: | Line 24: | ||
= Data Cleaning Process = | = Data Cleaning Process = | ||
| − | |||
{| class="wikitable" | {| class="wikitable" | ||
|- | |- | ||
! !! Problem #1 | ! !! Problem #1 | ||
|- | |- | ||
| − | | Issue || | + | | Issue || Upon data exploration, I found that the Static Sensor Locations and Readings are in two separate files. In order to make meaningful analysis, we would require the data from both files. |
|- | |- | ||
| − | | Solution || Join the two files in Tableau Prep Builder using the 'Join' function. We would be joining them on the sensor-id, which are unique identifiers of the static sensors. | + | | Solution || Join the two files in Tableau Prep Builder using the 'Join' function. We would be joining them on the sensor-id, which are unique identifiers of the static sensors. <br> |
| + | Steps: | ||
| + | # Import the StaticSensorLocations.csv and StaticSensorReadings.csv files into Tableau Prep Builder. | ||
| + | # Join the two files together on the sensor-id column as shown below. | ||
| + | <center>[[File:DataClean-1.png|400px|frameless]]</center> | ||
| + | |||
|} | |} | ||
| Line 38: | Line 42: | ||
! !! Problem #2 | ! !! Problem #2 | ||
|- | |- | ||
| − | | Issue || | + | | Issue || From the data description, we can tell that the user-id of the mobile sensors are not unique as some users choose not to change their user-id from the default, ‘MySensor’. This means that user-id is not a unique identifier of the mobile sensors. Furthermore, static sensors do not have any user-id tagged to it. Hence, it is redundant. Also, all the readings are taken in the units of counts per minute (cpm), hence there is no need for that column as all the column values are identical. |
|- | |- | ||
| − | | Solution || | + | | Solution || Drop the user-id and units column during data cleaning so as to remove any unnecessary attributes and reduce runtime. This can be done in Tableau Prep Builder. |
| + | <center>[[File:DataClean-2.png|400px|frameless]]</center> | ||
|} | |} | ||
| + | |||
| + | <br> | ||
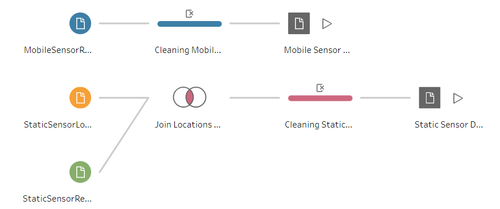
| + | Final Data Preparation Workflow from Tableau Prep Builder: <br> | ||
| + | <center>[[File:DataClean-3.png|500px|frameless]]</center> | ||
| + | <br> | ||
{| class="wikitable" | {| class="wikitable" | ||
| Line 47: | Line 57: | ||
! !! Problem #3 | ! !! Problem #3 | ||
|- | |- | ||
| − | | Issue || The mobile and | + | | Issue || The mobile sensor readings file only contains latitude and longitude data for the sensor positions, but does not provide any information regarding the neighbourhoods which the sensors are currently located in. This would pose a problem if we are trying to analyse the sensor readings based on the neighbourhoods, in order to identify which neighbourhoods have high uncertainty in readings. |
|- | |- | ||
| − | | Solution || | + | | Solution || Solution: We would be able to map each of the points by doing a spatial join between the MobileSensorReadings.csv and StHimark.shp shapefile, namely the Intercept Inner Join. This would create an additional ‘Neighbourhood’ column for us to identify the neighbourhood that the sensor is currently located in for us to do more detailed analysis. <br> |
| + | Steps: | ||
| + | # Import the StHimark.shp file and the MobileSensorReadings.csv file into Tableau. | ||
| + | # Combine the files using the Join function. The input should be as follows: | ||
| + | <center>[[File:DataClean-4.png|400px|frameless]]</center> | ||
|} | |} | ||
| Line 56: | Line 70: | ||
! !! Problem #4 | ! !! Problem #4 | ||
|- | |- | ||
| − | | Issue || | + | | Issue || From the data description, we can tell that the user-id of the mobile sensors are not unique as some users choose not to change their user-id from the default, ‘MySensor’. This means that user-id is not a unique identifier of the mobile sensors. Furthermore, static sensors do not have any user-id tagged to it. Hence, it is redundant. Also, all the readings are taken in the units of counts per minute (cpm), hence there is no need for that column as all the column values are identical. |
|- | |- | ||
| − | | Solution || | + | | Solution || Drop the user-id and units column during data cleaning so as to remove any unnecessary attributes and reduce runtime. This can be done in Tableau Prep Builder. |
|} | |} | ||
| Line 65: | Line 79: | ||
! !! Problem #5 | ! !! Problem #5 | ||
|- | |- | ||
| − | | Issue || | + | | Issue || The mobile sensor readings file only contains latitude and longitude data for the sensor positions, but does not have any neighbourhood data. This would pose a problem if we are trying to analyse the sensor readings based on the neighbourhood it is currently located in, in order to compare across neighbourhoods for our analysis. |
|- | |- | ||
| − | | Solution || | + | | Solution || We would be able to map each of the points by doing a spatial join between the MobileSensorReadings.csv and StHimark.shp shapefile, namely the Intercept Outer Join. This would create an additional ‘Neighbourhood’ column for us to identify the neighbourhood that the sensor is currently located in for us to do more detailed analysis. |
|} | |} | ||
| + | |||
{| class="wikitable" | {| class="wikitable" | ||
|- | |- | ||
! !! Problem #6 | ! !! Problem #6 | ||
| − | |||
| − | |||
| − | |||
| − | |||
| − | |||
| − | |||
| − | |||
| − | |||
| − | |||
| − | |||
| − | |||
| − | |||
| − | |||
| − | |||
| − | |||
| − | |||
| − | |||
| − | |||
|- | |- | ||
| Issue || The map provided, 'StHimarkNeighborhoodMap.png', is too rich in colour to be used as a background map image. | | Issue || The map provided, 'StHimarkNeighborhoodMap.png', is too rich in colour to be used as a background map image. | ||
|- | |- | ||
| Solution || I used Powerpoint to recolour the image to a greyscale. Upon applying washout before applying it as the background map image, I would then be able to obtain a background that does not take away the attention from the actual data points. | | Solution || I used Powerpoint to recolour the image to a greyscale. Upon applying washout before applying it as the background map image, I would then be able to obtain a background that does not take away the attention from the actual data points. | ||
| + | <center>[[File:DataClean-5.png|400px|frameless]]</center> | ||
|} | |} | ||
| − | |||
Latest revision as of 15:25, 12 October 2019
 VAST 2019 MC2: Citizen Science to the Rescue
|
|
|
|
|
|
Data Cleaning Process
| Problem #1 | |
|---|---|
| Issue | Upon data exploration, I found that the Static Sensor Locations and Readings are in two separate files. In order to make meaningful analysis, we would require the data from both files. |
| Solution | Join the two files in Tableau Prep Builder using the 'Join' function. We would be joining them on the sensor-id, which are unique identifiers of the static sensors. Steps:
 |
| Problem #2 | |
|---|---|
| Issue | From the data description, we can tell that the user-id of the mobile sensors are not unique as some users choose not to change their user-id from the default, ‘MySensor’. This means that user-id is not a unique identifier of the mobile sensors. Furthermore, static sensors do not have any user-id tagged to it. Hence, it is redundant. Also, all the readings are taken in the units of counts per minute (cpm), hence there is no need for that column as all the column values are identical. |
| Solution | Drop the user-id and units column during data cleaning so as to remove any unnecessary attributes and reduce runtime. This can be done in Tableau Prep Builder.
 |
Final Data Preparation Workflow from Tableau Prep Builder:

| Problem #3 | |
|---|---|
| Issue | The mobile sensor readings file only contains latitude and longitude data for the sensor positions, but does not provide any information regarding the neighbourhoods which the sensors are currently located in. This would pose a problem if we are trying to analyse the sensor readings based on the neighbourhoods, in order to identify which neighbourhoods have high uncertainty in readings. |
| Solution | Solution: We would be able to map each of the points by doing a spatial join between the MobileSensorReadings.csv and StHimark.shp shapefile, namely the Intercept Inner Join. This would create an additional ‘Neighbourhood’ column for us to identify the neighbourhood that the sensor is currently located in for us to do more detailed analysis. Steps:
 |
| Problem #4 | |
|---|---|
| Issue | From the data description, we can tell that the user-id of the mobile sensors are not unique as some users choose not to change their user-id from the default, ‘MySensor’. This means that user-id is not a unique identifier of the mobile sensors. Furthermore, static sensors do not have any user-id tagged to it. Hence, it is redundant. Also, all the readings are taken in the units of counts per minute (cpm), hence there is no need for that column as all the column values are identical. |
| Solution | Drop the user-id and units column during data cleaning so as to remove any unnecessary attributes and reduce runtime. This can be done in Tableau Prep Builder. |
| Problem #5 | |
|---|---|
| Issue | The mobile sensor readings file only contains latitude and longitude data for the sensor positions, but does not have any neighbourhood data. This would pose a problem if we are trying to analyse the sensor readings based on the neighbourhood it is currently located in, in order to compare across neighbourhoods for our analysis. |
| Solution | We would be able to map each of the points by doing a spatial join between the MobileSensorReadings.csv and StHimark.shp shapefile, namely the Intercept Outer Join. This would create an additional ‘Neighbourhood’ column for us to identify the neighbourhood that the sensor is currently located in for us to do more detailed analysis. |
| Problem #6 | |
|---|---|
| Issue | The map provided, 'StHimarkNeighborhoodMap.png', is too rich in colour to be used as a background map image. |
| Solution | I used Powerpoint to recolour the image to a greyscale. Upon applying washout before applying it as the background map image, I would then be able to obtain a background that does not take away the attention from the actual data points.
 |