Difference between revisions of "Cakrawala"
Fresi.2016 (talk | contribs) |
|||
| (2 intermediate revisions by 2 users not shown) | |||
| Line 48: | Line 48: | ||
<br> | <br> | ||
<br/> | <br/> | ||
| − | ==<div style="background:#f67c6c; padding: 15px; font-weight: bold; line-height: 0.3em; letter-spacing:0.5em;font-size:20px"><font color=#fff face="Century Gothic"><center> | + | ==<div style="background:#f67c6c; padding: 15px; font-weight: bold; line-height: 0.3em; letter-spacing:0.5em;font-size:20px"><font color=#fff face="Century Gothic"><center>SELECTED DATABASE</center></font></div>== |
<br/> | <br/> | ||
The Data Sets we will be using for our analysis and for our application is listed below: | The Data Sets we will be using for our analysis and for our application is listed below: | ||
| Line 365: | Line 365: | ||
==<div style="background:#f67c6c; padding: 15px; font-weight: bold; line-height: 0.3em; letter-spacing:0.5em;font-size:20px"><font color=#fff face="Century Gothic"><center>TECHNOLOGIES</center></font></div>== | ==<div style="background:#f67c6c; padding: 15px; font-weight: bold; line-height: 0.3em; letter-spacing:0.5em;font-size:20px"><font color=#fff face="Century Gothic"><center>TECHNOLOGIES</center></font></div>== | ||
<br/> | <br/> | ||
| − | The technologies we will be using for this Project | + | The technologies we will be using for this Project are as below: |
| − | [[File: | + | [[File:Cakrawala_Technologies_V2.png|650px|frameless|center]] |
| + | <br/> | ||
| + | <br/> | ||
| + | The updated technologies we used to develop our application are: | ||
| + | [[File:Cakrawala_Technologies_V3.png|650px|frameless|center]] | ||
<br/> | <br/> | ||
Latest revision as of 14:37, 24 November 2019
<--- Go Back to Project Groups
Contents
PROBLEM & MOTIVATION
The Ministry of Trade (Kementrian Perdagangan Republik Indonesia) and Central Agency of Statistics (Badan Pusat Statistik) of Indonesia has been providing comprehensive Indonesia’s trading data. However, the information is mostly displayed in a table format. Hence, it is challenging to derive analysis and insights.
Our motivation is to address lack of a comprehensive visualization platform to show the impact of export and import on indonesia’s trade of balance. Furthermore, through this platform, users can essentially identify areas of deficit and improvement on the available data that Indonesia can work on.
It is important to do so because Indonesia is the 4th largest country in the world and one of the largest consumption markets at the global level. Export also has been the engine of Indonesia economy yet it has been declining steadily in 2012 due to lower commodity price and dwindling global demand. Moreover, now in 2019, Indonesia’s export has dropped by 9.99 percent as compared to 2018.
OBJECTIVE
From the comprehensive datasets readily available in the Central Agency of Statistics (over 85 data sets), we will focus on the 3 main objectives. It is as follows:
- Gain overall insights on the Export and Import activities in Indonesia by countries and regions since 2002. We will also identify the top trading partner of Indonesia.
- Identify the yearly trends of Exported and Imported Oil and Gas and Non Oil and Gas in Indonesia by countries. This would give us a better understanding on potential type of goods that Indonesia could focus on.
- Gain insights on the yearly trade balance trends to identify potential trading opportunity for Indonesia.
SELECTED DATABASE
The Data Sets we will be using for our analysis and for our application is listed below:
| Dataset/Source | Data Attributes | Rationale Of Usage |
|---|---|---|
(1996 - 2019, July) |
|
|
Value of Exports by Major Countries of Destination (FOB value:million US$), 2000-2017
Value of Imports by Major Countries of Origin (CIF value: million US$), 2000-2017 |
|
|
Value of Exports by Major Ports (FOB value: million US$), 2000-2017
Value of Imports by Major Ports (CIF value: million US$), 2000-2017 |
|
|
Volume and Value of Indonesia Import and Export per Commodity
|
|
|
BACKGROUND SURVEY
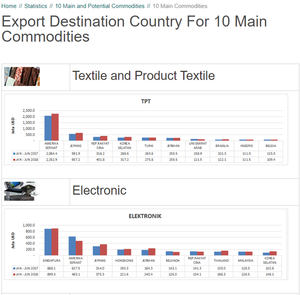
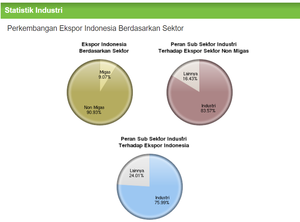
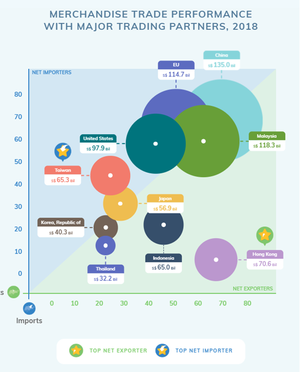
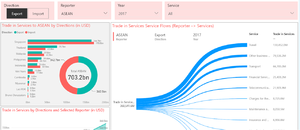
We did basic background research on some existing visualizations or dashboards we could drive inspirations from or make it better. Below are a few visuals we found:
| Reference of Other Interactive Visualization | Learning Point |
|---|---|
Title: Export Destination Country For 10 Main Commodities
|
Positive Points:
Negative Points:
|
Title: Indonesia Growth of Export by Sector
|
Positive Points:
Negative Points:
|
Title: Marchendise Trade Performance
|
Positive Points:
Negative Points:
|
Title: ASEAN's Stat |
Positive Points:
|
CONSIDERATION & VISUAL SELECTION
Below are a few visualizations and charts we considered making for our projects.
| Visual Considerations | Insights / Comments |
|---|---|
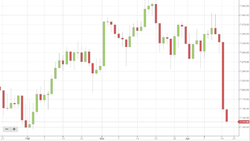
Title: Candlestick Graph Source: https://thestophunter.co.uk/technical-analysis-candlestick-charts/ |
Show the price movement at given instrument
|
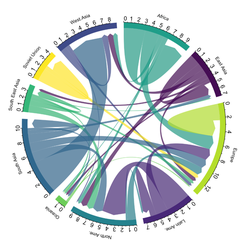
Title: Chord Graph |
Shows flows / connection between several entities
|
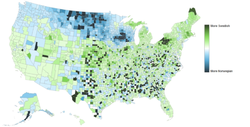
Title: Choropleth Map Source: https://viscomvibz.wordpress.com/2012/03/17/the-pros-cons-of-choropleth-maps-blot-maps-patch-maps/ |
Using coloring scheme to show the value levels
|
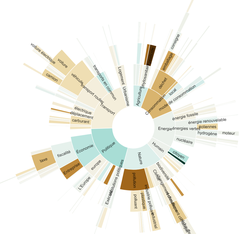
Title: Sunburst Graph |
Display the hierarchical data in circular format
|
BRAINSTORMING SESSION
During the first few brainstorming sessions, our initial idea was visualizing the hotspot (forest fire) in Indonesia. It started from our concern with the current haze situation in Singapore. Thus, we are determined to explore the effect of forest fire towards the air quality in several neighbouring country. After some preliminary research and consultation, feedback that we got was this topic will be more useful for scientific research purpose instead of visualization project. On top of that, this topic might limit the team to visualize as when PSI reading is involved, the affecting factor might not only forest fire but also wind direction and rainfall which is difficult to obtain the accurate data. Hence, we decided to drop the idea due to time constraint.
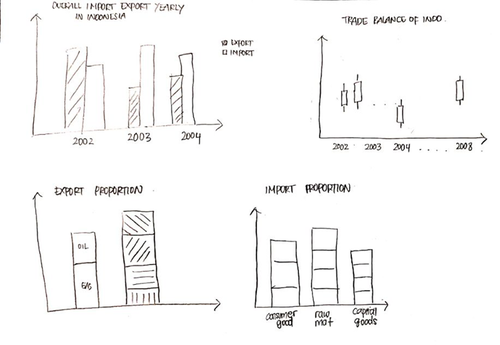
In the next few discussion, our group tried to look at the aspect of Indonesia that still lacking in visualization which directs us to the trading of Indonesia. We feel the importance to visualize trading in Indonesia as it is one of the most important factors for the country’s economic growth. Our group met several times to discuss the project objective and design the storyboard. In the import and export context, we tried to visualize what information is interesting for the user. Initially, we came up with the first four charts for our project with simple views so that the user can get all the information at one glance.
The first chart is the bar chart where it shows the total amount of both import and export every year; with second and third charts shows the proportion of oil & gas and non-oil & gas for both import and export.
The most interesting part will be on candlestick chart; where it will show the trade balance with the calculation of export minus import and each candlestick will be shaded with color where green means positive net trade balance while red means negative net trade balance. However, we decided to drop the candlestick chart that shows trade balance. It was because candlestick meant to show the price difference where raw data should have 4 attributes (e.g. close-open, high-low) and our data did not match with the purpose of this chart.
After a few sessions of brainstorming, we came up with our final designs which are listed below.
PROPOSED STORYBOARD
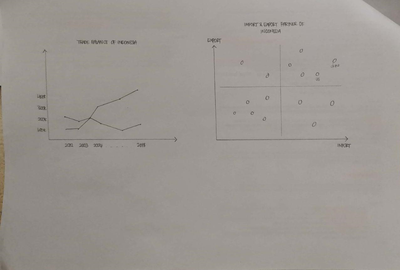
Below is the proposed story board for our project:
| Storyboard | Insights / Comments |
|---|---|
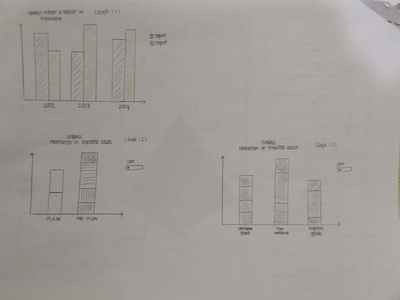
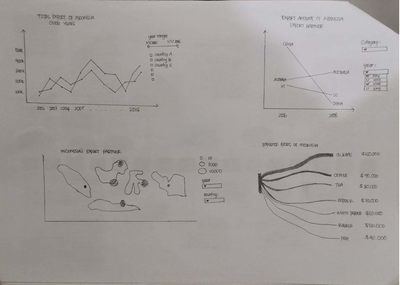
Title: DASHBOARD 1 - OVERVIEW (STORY 1 - OVERVIEW) |
|
Title: DASHBOARD 1 - OVERVIEW (STORY 2 - EXPORT, STORY 3 - IMPORT) |
|
Title: DASHBOARD 2 - CATEGORY (STORY 2 - EXPORT & IMPORT OF GAS & OIL; STORY 3 - EXPORT & IMPORT OF NON-GAS & OIL) |
|
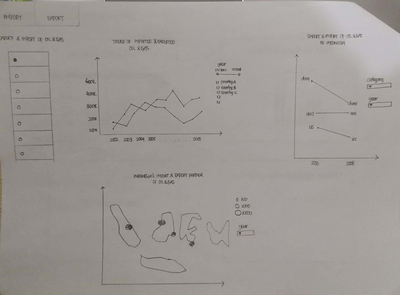
Title: DASHBOARD 3 - TRADE BALANCE |
|
TECHNOLOGIES
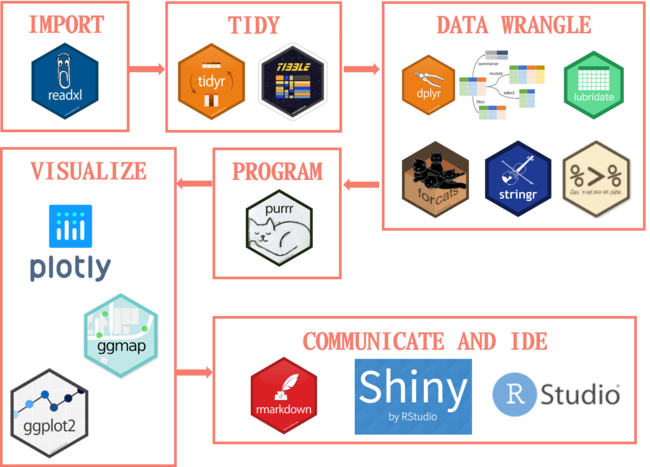
The technologies we will be using for this Project are as below:
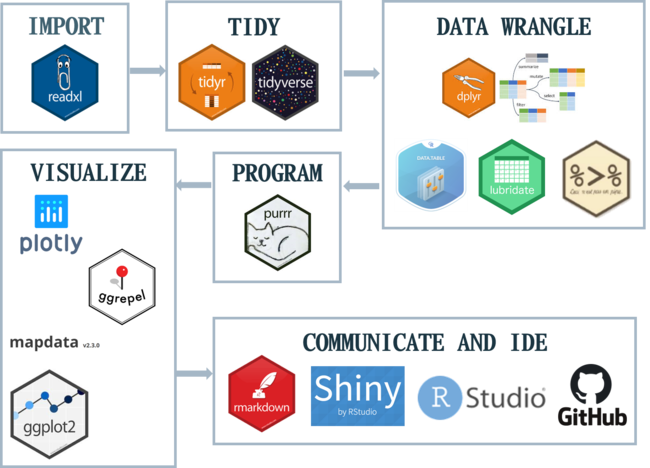
The updated technologies we used to develop our application are:
CHALLENGES
| Challenges | Mitigation Plan |
|---|---|
|
|
|
|
|
|
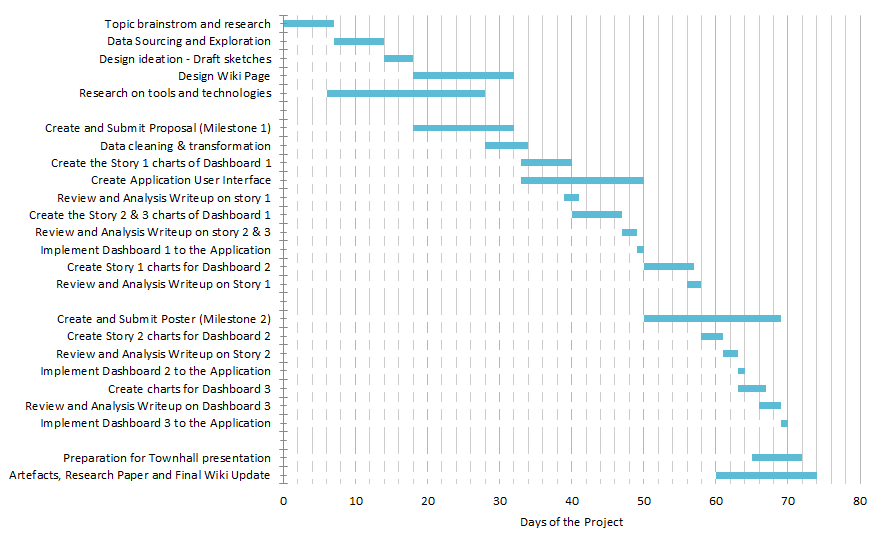
TIMELINE
COMMENTS
Feel free to leave us some comments so that we can improve!
| No. | Name | Date | Comments |
|---|---|---|---|
| 1. | Insert your name here | Insert date here | Insert comment here |
| 2. | Insert your name here | Insert date here | Insert comment here |
| 3. | Insert your name here | Insert date here | Insert comment here |
