Difference between revisions of "Data Page"
Jump to navigation
Jump to search
(Created page with "<font size="5">'''Mini-Challenge 1: Crowdsourcing for Situational Awareness'''</font> <!--MAIN HEADER --> {|style="background-color:#1B338F;" width="100%" cellspacing="0" cell...") |
|||
| Line 20: | Line 20: | ||
| | | | ||
|} | |} | ||
| − | |||
=Introducation of the Data= | =Introducation of the Data= | ||
Revision as of 21:22, 13 October 2019
Mini-Challenge 1: Crowdsourcing for Situational Awareness
|
|
|
|
|
Introducation of the Data
The dataset countains two parts, image data and text data:
Image data:
- Pre-quake Shake Map
- Major-quake Shake Map
- St. Himark City Map by Location
Text data:
Report data: The dataset contains individual reports of shaking/damage by neighborhood over time, from 6th April to 11th April.
Pre-Analysis Data Processing
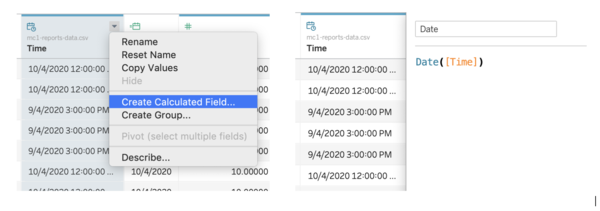
1. The timestamp given in the dataset is in 'YYYY-MM-DD hh:mm:ss' format. For easy aggregation, a new column 'Date' is created.

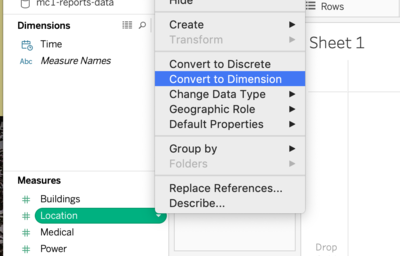
2. The 'Location' column is identified as a measure when imported to Tableau. It is configured to a dimension for visualization purposes later.
