Difference between revisions of "IS428 AY2019-20T1 Assign Chye Soon Hang Dashboard"
Shchye.2017 (talk | contribs) |
Shchye.2017 (talk | contribs) |
||
| Line 24: | Line 24: | ||
</div> | </div> | ||
<h1>Link to Dashboard</h1> | <h1>Link to Dashboard</h1> | ||
| − | https://public.tableau.com/views/VASTMC22019ChyeSoonHang/ | + | https://public.tableau.com/views/VASTMC22019ChyeSoonHang/Introduction?:embed=y&:display_count=yes&:origin=viz_share_link |
<h1>Introduction Page</h1> | <h1>Introduction Page</h1> | ||
<br> | <br> | ||
Latest revision as of 19:08, 13 October 2019
Contents
Link to Dashboard
Introduction Page
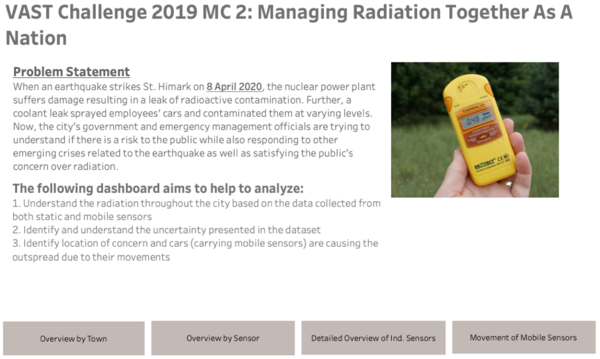
To help users navigate around the dataset better, I have segregated the dataset into multiple visualization to display different insights. To start off, user will first be greeted by the Introduction page as show above, which helps to give a brief problem statement and objectives. Lastly, it will also display 4 buttons to navigate to the following visualization:
- Overview by Town – Allow users to see the radiation reading by town according the time they filter by
- Overview by Sensor - Allow users to see the radiation reading by sensors according the time they filter by
- Detailed Overview of Ind. Sensors - Allow users to check on the fluctuations of individual sensors
- Movement of Mobile Sensors – Allow uses to see how the mobile sensors (cars) move around the town and potentially spread the radiation if contaminated
Overview by Town Page
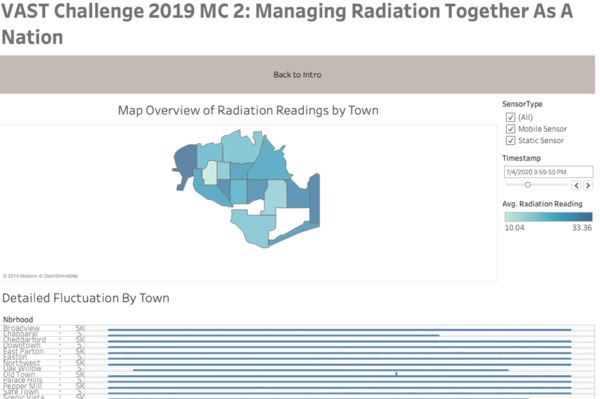
This visualization aims to show users the radiation reading/contamination level of individual town at different point of the day
| Features | Rationale | Brief Implementation Steps |
|---|---|---|
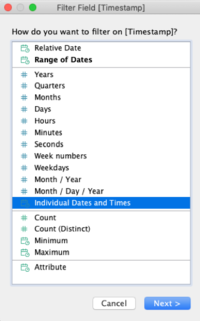
| Allow users to set the timestamp to check the radiation readings at that point of time |
Overview by Sensors
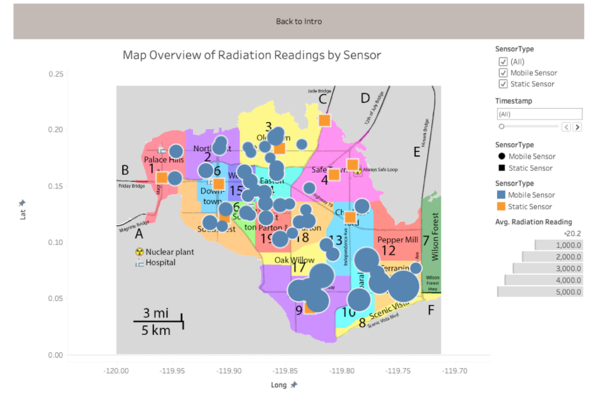
This visualization aims to show users the radiation levels based on all of the sensors spread across the map and can filter by time and sensor type.
| Features | Rationale | Brief Implementation Steps |
|---|---|---|
| Allow users to set the timestamp to check the radiation readings at that point of time | ||
| Allow users to filter to see only the sensor type they want to see |
|
Detailed Overview of Ind. Sensors
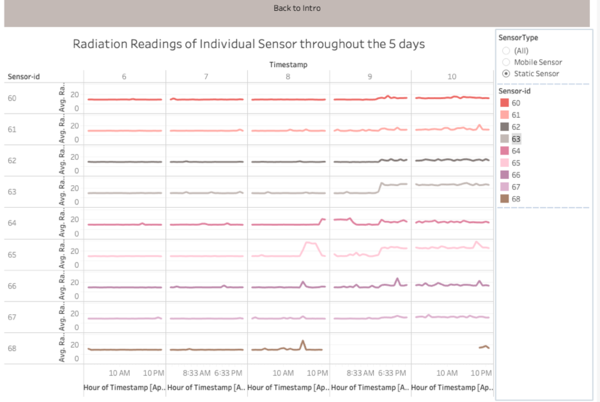
This visualization aims to give the users a more in-depth understandings of the data captured in individual sensors and analyze its fluctuations over the 5 days.
| Features | Rationale | Brief Implementation Steps |
|---|---|---|
| Allow users to filter to see only the sensor type they want to see |
|
Movement of Mobile Sensors
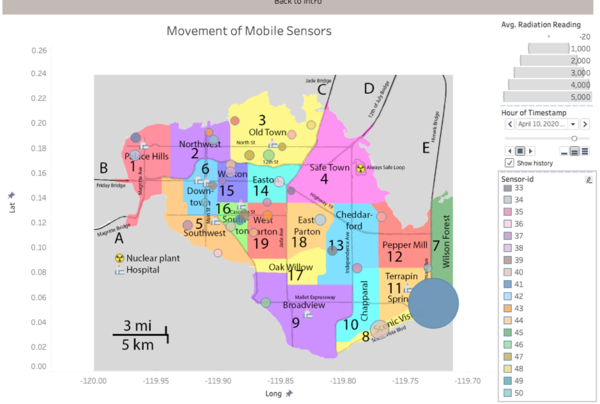
This visualization helps to illustrate the movements of mobile sensors. As there is possibility of contamination outspread due to the sensors’ movement, it will be beneficial to be able to track the movements over the 5 days.
| Features | Rationale | Brief Implementation Steps |
|---|---|---|
| Allow users to set the timestamp to check the radiation readings at that point of time |
