Difference between revisions of "IS428 AY2019-20T1 Assign Harvey Kristanto Lauw: Dataset"
| (9 intermediate revisions by the same user not shown) | |||
| Line 8: | Line 8: | ||
| style="font-family:Century Gothic; font-size:100%; solid #000000; background:#008000; text-align:center;" width="25%" | | | style="font-family:Century Gothic; font-size:100%; solid #000000; background:#008000; text-align:center;" width="25%" | | ||
; | ; | ||
| − | [[IS428_AY2019-20T1_Assign_Harvey_Kristanto_Lauw| <font color="# | + | [[IS428_AY2019-20T1_Assign_Harvey_Kristanto_Lauw| <font color="#FFFFFF">Background</font>]] |
| style="font-family:Century Gothic; font-size:100%; solid #000000; background:#808000; text-align:center;" width="25%" | | | style="font-family:Century Gothic; font-size:100%; solid #000000; background:#808000; text-align:center;" width="25%" | | ||
| Line 16: | Line 16: | ||
| style="font-family:Century Gothic; font-size:100%; solid #000000; background:#A52A2A; text-align:center;" width="25%" | | | style="font-family:Century Gothic; font-size:100%; solid #000000; background:#A52A2A; text-align:center;" width="25%" | | ||
; | ; | ||
| − | [[IS428_AY2019-20T1_Assign_Harvey_Kristanto_Lauw: | + | [[IS428_AY2019-20T1_Assign_Harvey_Kristanto_Lauw:_Visualisation_Task_1| <font color="#FFFFFF">Interactive Visualization</font>]] |
| style="font-family:Century Gothic; font-size:100%; solid #000000; background:#800000; text-align:center;" width="25%" | | | style="font-family:Century Gothic; font-size:100%; solid #000000; background:#800000; text-align:center;" width="25%" | | ||
; | ; | ||
| − | [[IS428_AY2019-20T1_Assign_Harvey_Kristanto_Lauw: | + | [[IS428_AY2019-20T1_Assign_Harvey_Kristanto_Lauw:_Others| <font color="#FFFFFF">Others</font>]] |
| | | | ||
|} | |} | ||
| − | + | <br/> | |
<font size="5">'''Datasets'''</font> | <font size="5">'''Datasets'''</font> | ||
| Line 48: | Line 48: | ||
{| border="1" cellpadding="1" | {| border="1" cellpadding="1" | ||
|- style="background-color:#800000; color:white; height:50px" | |- style="background-color:#800000; color:white; height:50px" | ||
| − | ! style="width: | + | ! style="width:200px"| Description |
| − | ! style="width: | + | ! style="width:550px"| Reference |
|- | |- | ||
|| | || | ||
| − | + | <font size="3.5">'''Overview'''</font> | |
|| | || | ||
<center> | <center> | ||
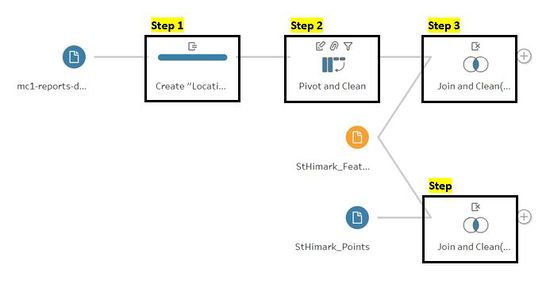
| − | [[File:Dataset Transformation Overview.jpg| | + | [[File:Dataset Transformation Overview.jpg|550px|border]] |
<br>'''Figure 0.1'''</br> | <br>'''Figure 0.1'''</br> | ||
</center> | </center> | ||
| Line 62: | Line 62: | ||
|| | || | ||
| − | + | <font size="3.5">'''Step 1: Creation of Calculated Field'''</font> | |
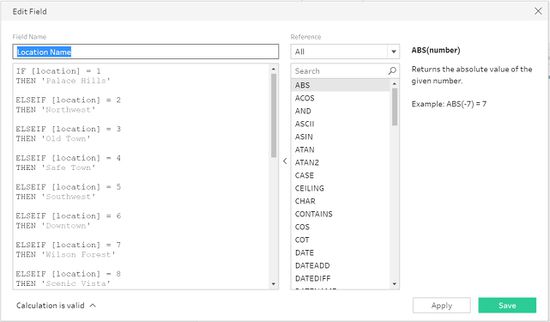
| − | Using “location” as an ID to create a calculated field (Refer to Figure 0.2) of “Location Name” based on the word document reference for the background of St. Himark, ''VAST 2019 - St. Himark - About Our City.docx''. | + | Using “location” as an ID to create a calculated field '''(Refer to Figure 0.2)''' of “Location Name” based on the word document reference for the background of St. Himark, ''VAST 2019 - St. Himark - About Our City.docx''. |
| − | |||
|| | || | ||
<center> | <center> | ||
| − | [[File:Dataset step 1.1.jpg| | + | [[File:Dataset step 1.1.jpg|550px|border]] |
<br>'''Figure 0.2'''</br> | <br>'''Figure 0.2'''</br> | ||
</center> | </center> | ||
| Line 75: | Line 74: | ||
|| | || | ||
| − | + | <font size="3.5">'''Step 2: Pivot and Clean'''</font> | |
Pivot 6 columns: Sewer & Water, Power, Roads & Bridges, Medical, Buildings & Shake intensity. | Pivot 6 columns: Sewer & Water, Power, Roads & Bridges, Medical, Buildings & Shake intensity. | ||
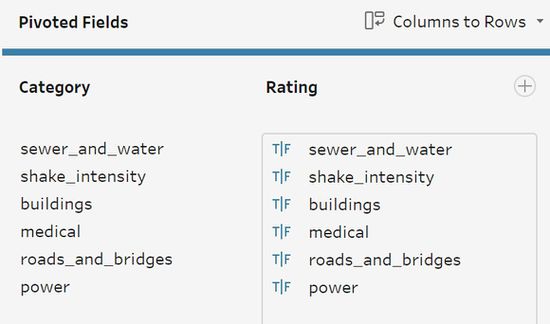
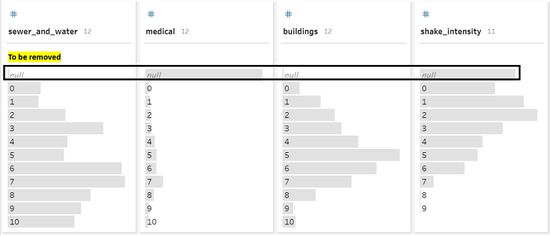
| − | Cleaning of data source: Proper Renaming of header row (Refer to Figure 0.3) and Removal of Null Values (Refer to Figure 0.4). | + | Cleaning of data source: Proper Renaming of header row '''(Refer to Figure 0.3)''' and Removal of Null Values '''(Refer to Figure 0.4)'''. |
* Pivot category -> Category | * Pivot category -> Category | ||
* Pivot value -> Rating | * Pivot value -> Rating | ||
| Line 84: | Line 83: | ||
Result in Number of rows: 83072 -> 438494 | Result in Number of rows: 83072 -> 438494 | ||
| − | |||
|| | || | ||
<center> | <center> | ||
| − | [[File:Dataset step 2.1.jpg| | + | [[File:Dataset step 2.1.jpg|550px|border]] |
<br>'''Figure 0.3'''</br> | <br>'''Figure 0.3'''</br> | ||
| − | [[File:Dataset step 2.2.jpg| | + | [[File:Dataset step 2.2.jpg|550px|border]] |
<br>'''Figure 0.4'''</br> | <br>'''Figure 0.4'''</br> | ||
</center> | </center> | ||
| Line 98: | Line 96: | ||
|| | || | ||
| − | + | <font size="3.5">'''Step 3: Join and Clean Part 1'''</font> | |
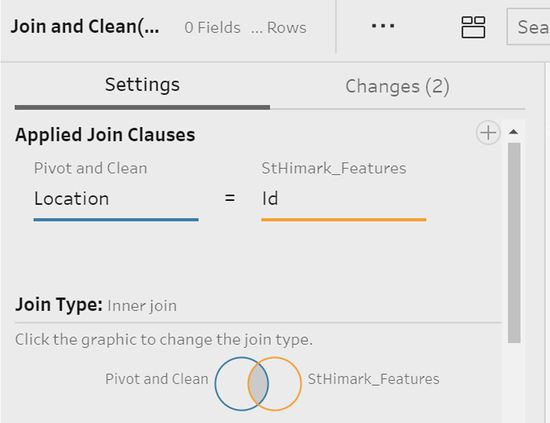
| − | Joining with ''mc1-reports-data.csv'' & ''StHimark_Features.csv'' with these 2 identifiers (Refer to Figure 0.5) respectively: “location” & “id” to populate the data column, “StHimark_ID”. And Removal of unwanted columns: Latitude & Longitude (These points are not accurate and does not create the shape of the map, hence the decision to remove). | + | Joining with ''mc1-reports-data.csv'' & ''StHimark_Features.csv'' with these 2 identifiers '''(Refer to Figure 0.5)''' respectively: “location” & “id” to populate the data column, “StHimark_ID”. And Removal of unwanted columns: Latitude & Longitude (These points are not accurate and does not create the shape of the map, hence the decision to remove). |
| − | * Final product: ''MC1 Report.hyper'' (Refer to Figure 0.6) | + | * Final product: ''MC1 Report.hyper'' '''(Refer to Figure 0.6)''' |
| − | |||
|| | || | ||
<center> | <center> | ||
| − | [[File:Dataset step 3.1.jpg| | + | [[File:Dataset step 3.1.jpg|550px|border]] |
<br>'''Figure 0.5'''</br> | <br>'''Figure 0.5'''</br> | ||
| − | [[File:Dataset step 3.2.jpg| | + | [[File:Dataset step 3.2.jpg|550px|border]] |
<br>'''Figure 0.6'''</br> | <br>'''Figure 0.6'''</br> | ||
</center> | </center> | ||
| Line 117: | Line 114: | ||
|| | || | ||
| − | + | <font size="3.5">'''Step 4: Join and Clean Part 2'''</font> | |
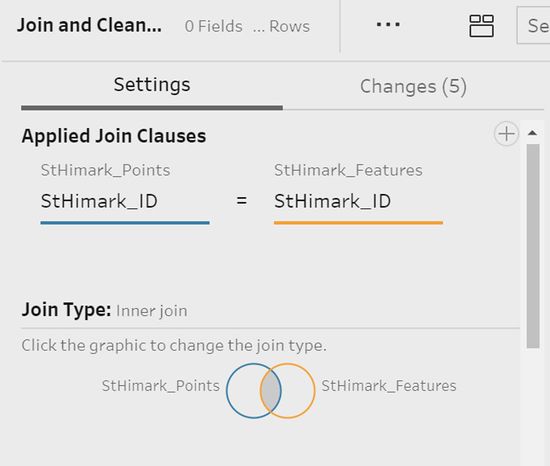
| − | Joining with ''StHimark_Features.csv'' & ''StHimark_Points.csv'' with these 2 identifiers (Refer to Figure 0.7) respectively: “StHimark_ID” & “StHimark_ID”. And Removal of unwated columns: Latitude (StHimark_Features.csv) & Longitude (StHimark_Features.csv), Nbrhood, sub_polygon_id and StHimark_ID (StHimark_Features.csv). | + | Joining with ''StHimark_Features.csv'' & ''StHimark_Points.csv'' with these 2 identifiers '''(Refer to Figure 0.7)''' respectively: “StHimark_ID” & “StHimark_ID”. And Removal of unwated columns: Latitude (StHimark_Features.csv) & Longitude (StHimark_Features.csv), Nbrhood, sub_polygon_id and StHimark_ID (StHimark_Features.csv). |
| − | * Final product: ''MC1 Map.hyper'' (Refer to Figure 0.8) | + | * Final product: ''MC1 Map.hyper'' '''(Refer to Figure 0.8)''' |
| − | |||
|| | || | ||
<center> | <center> | ||
| − | [[File:Dataset step 4.1.jpg| | + | [[File:Dataset step 4.1.jpg|550px|border]] |
<br>'''Figure 0.7'''</br> | <br>'''Figure 0.7'''</br> | ||
| − | [[File:Dataset step 4.2.jpg| | + | [[File:Dataset step 4.2.jpg|550px|border]] |
<br>'''Figure 0.8'''</br> | <br>'''Figure 0.8'''</br> | ||
</center> | </center> | ||
Latest revision as of 17:44, 13 October 2019
|
|
|
|
|
Datasets
Before we start with the data analysis, there is a need to understand and read the raw data. For this VAST Challenge 2019: Mini-Challenge 1, I am given 1 dataset which is:
- mc1-reports-data.csv [Data columns:Time | Sewer & Water | Power | Roads & Bridges | Medical | Buildings | Shake intensity | Location ]
For this Challenge, I will be leveraging on the custom polygon maps for St. Himark in order to create map visualizations with the 2 datasets listed below:
- StHimark_Features.csv [Data columns:Id | Nbrhood | StHimark_ID | Latitude | Longitude ]
- StHimark_Points.csv [Data columns:StHimark_ID | sub_polygon_id | point_order | Latitude | Longitude ]
Exploratory Data Analysis
Moving on to the data analysis, I will be performing Exploratory Data Analysis using Tableau Prep Builder. There are some issues with the original dataset listed below:
Columns with Null Values
- Sewer & Water: 171 counts of Null values
- Medical: 47441 counts of Null values
- Building: 170 counts of Null values
- Shake Intensity: 12144 counts of Null values
We cannot simply replace the Null values as columns like “Medical” and “Shake Intensity” contains a significant number of records with Null value to replace. If chosen to replace with mean or median, it will drastically change the variation of the distribution. Hence, the decision is to remove these values. Removed values will be in a form of records with the sole category and the rating itself, as pivoting will be done during the dataset transformation.
Dataset Transformation
| Description | Reference |
|---|---|
|
Overview |
|
|
Step 1: Creation of Calculated Field Using “location” as an ID to create a calculated field (Refer to Figure 0.2) of “Location Name” based on the word document reference for the background of St. Himark, VAST 2019 - St. Himark - About Our City.docx. |
|
|
Step 2: Pivot and Clean Pivot 6 columns: Sewer & Water, Power, Roads & Bridges, Medical, Buildings & Shake intensity. Cleaning of data source: Proper Renaming of header row (Refer to Figure 0.3) and Removal of Null Values (Refer to Figure 0.4).
Result in Number of rows: 83072 -> 438494 |
|
|
Step 3: Join and Clean Part 1 Joining with mc1-reports-data.csv & StHimark_Features.csv with these 2 identifiers (Refer to Figure 0.5) respectively: “location” & “id” to populate the data column, “StHimark_ID”. And Removal of unwanted columns: Latitude & Longitude (These points are not accurate and does not create the shape of the map, hence the decision to remove).
|
|
|
Step 4: Join and Clean Part 2 Joining with StHimark_Features.csv & StHimark_Points.csv with these 2 identifiers (Refer to Figure 0.7) respectively: “StHimark_ID” & “StHimark_ID”. And Removal of unwated columns: Latitude (StHimark_Features.csv) & Longitude (StHimark_Features.csv), Nbrhood, sub_polygon_id and StHimark_ID (StHimark_Features.csv).
|
|

