Difference between revisions of "IS428 AY2019-20T1 Assign Greg Tan Boon Kit Data Visualisation"
Jump to navigation
Jump to search
| Line 29: | Line 29: | ||
| | | | ||
|} | |} | ||
| + | |||
| + | == Dashboard Link == | ||
| + | The link of the visualization can be found here: | ||
| + | <br> | ||
| + | Please view the visualization through the link for the most precise usage of the visualisation. | ||
| + | |||
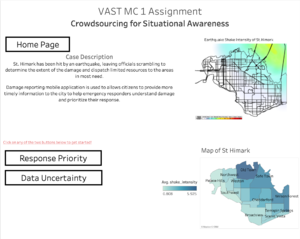
| + | == Dashboard 1: Home Page == | ||
| + | [[File:homepage2.png|frameless|center]] | ||
| + | |||
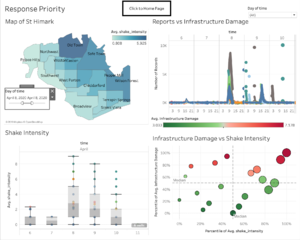
| + | == Dashboard 2: Response Priority == | ||
| + | [[File:homepage1.png|frameless|center]] | ||
| + | |||
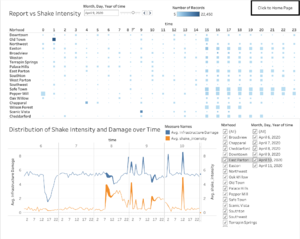
| + | == Dashboard 3: Data Uncertainty == | ||
| + | [[File:Gpage2.png|frameless|center]] | ||
Revision as of 17:41, 13 October 2019
|
|
|
|
|
|
Contents
Dashboard Link
The link of the visualization can be found here:
Please view the visualization through the link for the most precise usage of the visualisation.


