Difference between revisions of "IS428 AY2019-20T1 Assign Lee Cheng Leng Visualisation 1"
Jump to navigation
Jump to search
Cllee.2017 (talk | contribs) |
Cllee.2017 (talk | contribs) |
||
| Line 24: | Line 24: | ||
<hr> | <hr> | ||
{|style="background-color:#3D5480;" width="100%" cellspacing="0" cellpadding="0" valign="top" border="0" | | {|style="background-color:#3D5480;" width="100%" cellspacing="0" cellpadding="0" valign="top" border="0" | | ||
| − | | style="font-family:Century Gothic; font-size:100%; solid #000000; background:#3D5480; text-align:center;" width=" | + | | style="font-family:Century Gothic; font-size:100%; solid #000000; background:#3D5480; text-align:center;" width="20%" | |
; | ; | ||
[[IS428_AY2019-20T1_Assign_Lee_Cheng_Leng_Visualisations| <font color="#FFFFFF">Overview</font>]] | [[IS428_AY2019-20T1_Assign_Lee_Cheng_Leng_Visualisations| <font color="#FFFFFF">Overview</font>]] | ||
Revision as of 14:44, 13 October 2019
 VAST 2019 MC2: Citizen Science to the Rescue
|
|
|
|
|
|
|
|
|
|
|
|
|
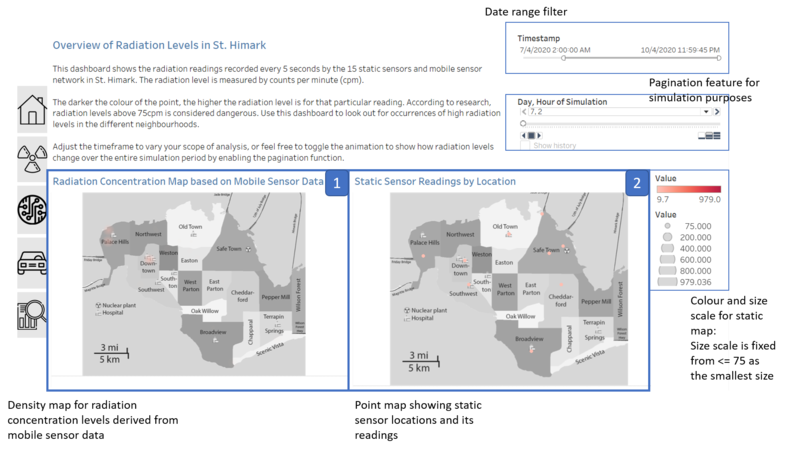
Dashboard 1: Overview of Radiation Levels in St. Himark

Component 1: Radiation Concentration Map
Purpose
- Shows the radiation concentration levels over time, with the radiation levels reflected from the mobile sensor data.
- Allows user to identify neighbourhoods with high radiation concentration
Description
- Mobile sensor data was chosen for this visualisation as it had higher coverage over the various St. Himark neighbourhoods
- Density map is useful in showing the radiation "hot spots" at a glance - if radiation levels are higher in the neighbourhood, the opacity and intensity of the spots will increase.
Component 2: Static Sensor Heatmap
Purpose
- Shows the radiation levels reported by the static sensors
- Provides data to identify the radiation levels at the more crucial areas of St. Himark, such as the nuclear plant.
Description
- Uses colour intensity to clearly indicate sensors which are reporting high radiation levels
- The size range is adjusted such that readings below 75 are the smallest in size. This is because it is found that the maximum acceptable background radiation level is 75cpm.