Difference between revisions of "IS428 AY2019-20T1 Assign Tommy Johnson Visualization"
| (One intermediate revision by the same user not shown) | |||
| Line 27: | Line 27: | ||
=== Home Page=== | === Home Page=== | ||
| − | This is the homepage that provides the details of the problem happened in St. HiMark city. There are 3 tabs focusing on static sensor, mobile sensor, and both sensor's reading level shown in a regional map. Each sensor will focus on 3 type of charts namely map chart, line chart based on log scale and Cumulative Sum chart. | + | This is the homepage that provides the details of the problem happened in St. HiMark city. There are 3 tabs focusing on static sensor, mobile sensor, and both sensor's reading level shown in a regional map. Each sensor will focus on 3 type of charts namely map chart, line chart based on log scale and Cumulative Sum chart. |
| − | [[File: | + | [[File:Homepage.PNG|500px|centre]] |
| + | {| class="wikitable" | ||
| + | |- | ||
| + | ! style="font-weight: bold;background: #7fc6cb;width: 20%;" | Interactive Features | ||
| + | ! style="font-weight: bold;background: #7fc6cb;width: 40%" | Rationale | ||
| + | ! style="font-weight: bold;background: #7fc6cb;" | Brief Implementation Steps | ||
| + | |- | ||
| + | | <center>'''Button to view the different visualizations ''' <br/> | ||
| + | || <center>To improve user experience in data visualization </center> | ||
| + | || | ||
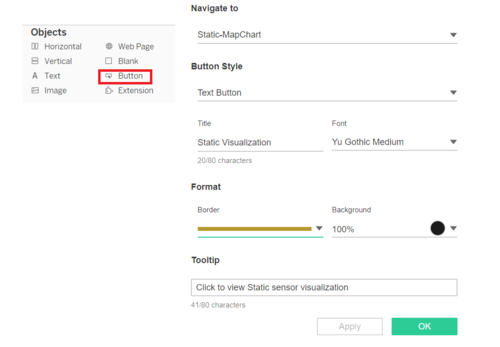
| + | # Create a dashboard in the tableau. Then, drag the button to the bottom of the page | ||
| + | # Edit the button accordingly as per shown in the picture <br/> [[File:Button.PNG|500px|center]] | ||
| + | |} | ||
=== Radiation Level by Map Chart === | === Radiation Level by Map Chart === | ||
I am using map chart to visualize the radiation measurements for both static and mobile sensors. With this chart, analysts will be able to see which areas are prone to high or low radiation levels from each sensor types. Adding on, they are able to visualize the track that one mobile sensor took throughout the day and how these affect the readings. | I am using map chart to visualize the radiation measurements for both static and mobile sensors. With this chart, analysts will be able to see which areas are prone to high or low radiation levels from each sensor types. Adding on, they are able to visualize the track that one mobile sensor took throughout the day and how these affect the readings. | ||
Latest revision as of 11:55, 13 October 2019
The interactive visualization can be accessed here: https://public.tableau.com/profile/tommy2780#!/vizhome/DataVisualization_Assignment_VastChallenge2/HomePage?publish=yes
Contents
Home Page
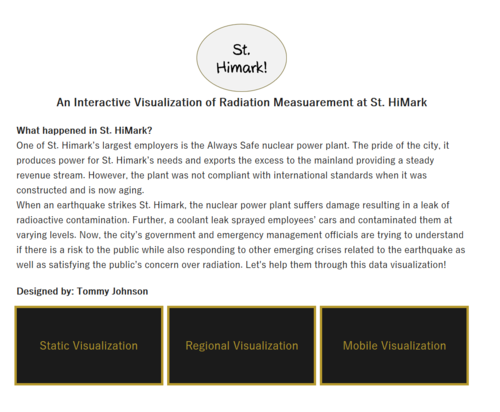
This is the homepage that provides the details of the problem happened in St. HiMark city. There are 3 tabs focusing on static sensor, mobile sensor, and both sensor's reading level shown in a regional map. Each sensor will focus on 3 type of charts namely map chart, line chart based on log scale and Cumulative Sum chart.
| Interactive Features | Rationale | Brief Implementation Steps |
|---|---|---|
|
Radiation Level by Map Chart
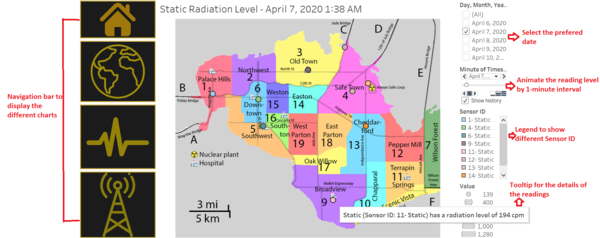
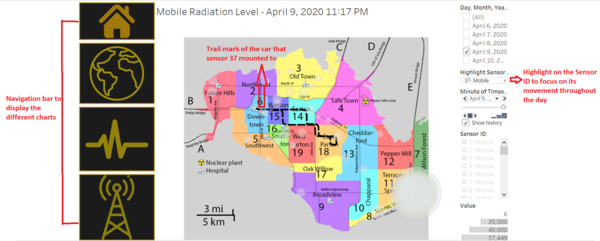
I am using map chart to visualize the radiation measurements for both static and mobile sensors. With this chart, analysts will be able to see which areas are prone to high or low radiation levels from each sensor types. Adding on, they are able to visualize the track that one mobile sensor took throughout the day and how these affect the readings.
Static sensor radiation level
Mobile sensor radiation level
To enhance the visualization of the data, implementing interactive elements would help users in analyzing the data intuitively. The following elements are used in this graph.
| Interactive Features | Rationale | Brief Implementation Steps |
|---|---|---|
| Click on the arrow button on the Sensor ID filter and choose "Show Highlighter | ||
| ||
| ||
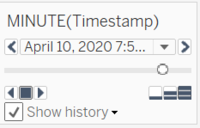
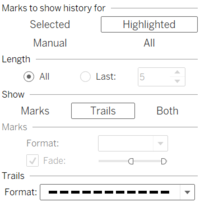
| Change the setting of the Timestamp pages as per following image |
Next, let's look at how i displayed the line chart based on log scale.
Readings Level by sensor type
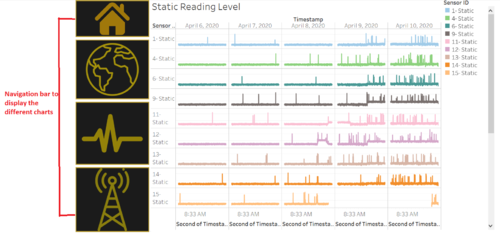
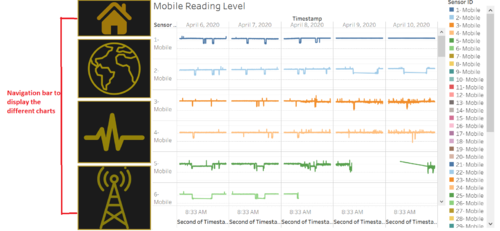
For further breakdown, I visualize how the readings changes over time according to the sensor type.This visualization allows the analyst to look at the pattern of the readings at one glance. to ensure that the distribution is less skewed, i used the logarithm on the value readings.
Static reading level
Mobile reading level
The snapshot below is not limited. Analysts are able to scroll down to view more reading levels from different sensor Id
| Major features included | Rationale | Brief Implementation Steps |
|---|---|---|
| Drag the sensor ID to the color Marks | ||
| Drag the Timestamp in the Columns and custom the date to Month/Date/Year with Date Part option | ||
| Create a calculated field of log value. Then, put it at the Rows |
Cumulative Sum Chart by sensor type
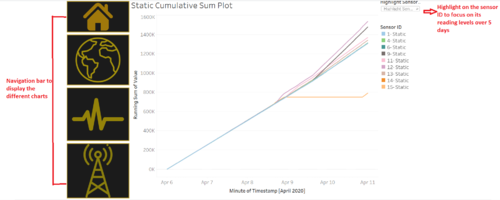
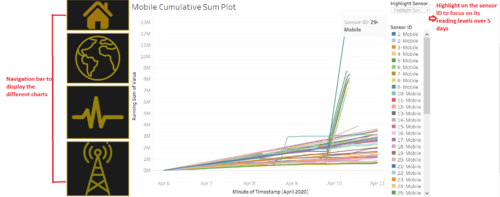
To visualize which sensors we need to pay more attention to based on the readings level, I am using a cumulative sum chart which display how each sensor's reading level change over time since day 1 to day 5.
Static Cumulative Sum Chart
Mobile Cumulative Sum Chart
| Interactive Features | Rationale | Brief Implementation Steps |
|---|---|---|
| Click on the arrow button on the Sensor ID filter and choose "Show Highlighter" |
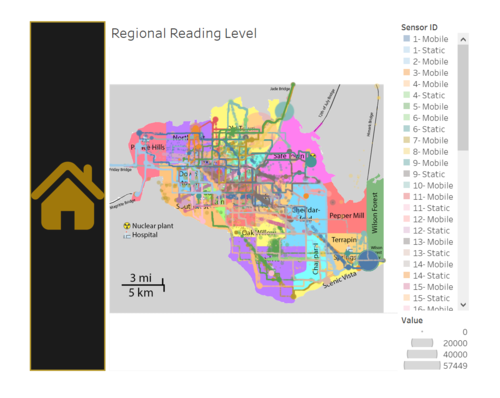
Regional reading levels
I display the readings level by regional as well. With these, it will be able to provide insight on which area of concern that we need to pay attention to. For example, as we can see, Jade Bridge, Wilson Forest, and Old Town area has the highest readings level across time and sensors. More details will be explained in the later part.

