Difference between revisions of "HomeIntel"
| Line 71: | Line 71: | ||
{| class="wikitable" style="margin-left: auto; margin-right: auto; width: 90%; | {| class="wikitable" style="margin-left: auto; margin-right: auto; width: 90%; | ||
|- | |- | ||
| − | ! style="background:# | + | ! style="background:#7dcfe8;|Reference of Other Interactive Visualization !!style="background:#7dcfe8;| Learning Points |
|- | |- | ||
| | | | ||
Revision as of 03:43, 13 October 2019
<--- Go Back to Project Groups
Contents
Problem and Motivation
Objectives
Selected Dataset
The Data Sets we will be using for our analysis and for our application is listed below:
| Dataset/Source | Data Attributes | Rationale of Usage |
|---|---|---|
Resale Flat Price (Jan 2015 - Aug 2019)
|
|
This dataset will be used to understand the resale transacted price and see the price trend change over year. |
Background Survey
Our team did background research on the topic before creating the storyboards. It will expose us to the different types of charts and graphs that we can use for the project and consider how we can make it better. Some of the visualisations that we draw inspiration from are as follows:
| Reference of Other Interactive Visualization | Learning Points |
|---|---|
|
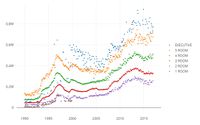
Title: Historical Average of HDB Resale Prices in Ang Mo Kio
|
|
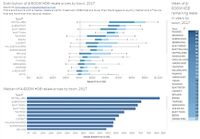
Title: Distribution of 4-Room HDB Resale Prices By Town |
|
Title: Singapore Property Prices Heatmap Source: https://www.greyloft.com/singapore/property-prices-heatmap |
|
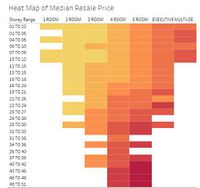
Title: Heat Map of Median Resale Price Source: https://public.tableau.com/profile/darrick8462#!/vizhome/HDBResaleAnalysisDDO/HDBRESALEDASHBOARD |
|


