Difference between revisions of "IS428 AY2019-20T1 Assign He Yicheng: Preparation"
| Line 33: | Line 33: | ||
* StaticSensorLocations.csv - contains the different static sensor Ids with its locations | * StaticSensorLocations.csv - contains the different static sensor Ids with its locations | ||
| − | I will start with importing <b> | + | I will start with importing <b> Mobile Sensor Data</b> and then <b>Static Sensor Data</b>. |
</div> | </div> | ||
| − | |||
| − | |||
| − | |||
| − | + | == <div style="font-weight:300;padding: 10px 13px 20px 13px; line-height:10px;font-family:HelveticaNeue-Light, Helvetica Neue Light, Helvetica Neue, Helvetica, Arial, Lucida Grande, sans-serif;font-size:25px">Create Mobile Sensor Map Graph</font></div>== | |
| − | |||
| − | |||
| − | == <div style="font-weight:300;padding: 10px 13px 20px 13px; line-height:10px;font-family:HelveticaNeue-Light, Helvetica Neue Light, Helvetica Neue, Helvetica, Arial, Lucida Grande, sans-serif;font-size:25px">Create | ||
<div style="font-weight:300;margin-bottom: 60px;margin-top:15px;max-width:700px;margin-left:15px;font-family:HelveticaNeue-Light, Helvetica Neue Light, Helvetica Neue, Helvetica, Arial, Lucida Grande, sans-serif;font-size:17px;> | <div style="font-weight:300;margin-bottom: 60px;margin-top:15px;max-width:700px;margin-left:15px;font-family:HelveticaNeue-Light, Helvetica Neue Light, Helvetica Neue, Helvetica, Arial, Lucida Grande, sans-serif;font-size:17px;> | ||
| Line 89: | Line 83: | ||
== <div style="font-weight:300;padding: 10px 13px 20px 13px; line-height:10px;font-family:HelveticaNeue-Light, Helvetica Neue Light, Helvetica Neue, Helvetica, Arial, Lucida Grande, sans-serif;font-size:25px">5. xxx</font></div>== | == <div style="font-weight:300;padding: 10px 13px 20px 13px; line-height:10px;font-family:HelveticaNeue-Light, Helvetica Neue Light, Helvetica Neue, Helvetica, Arial, Lucida Grande, sans-serif;font-size:25px">5. xxx</font></div>== | ||
| + | |||
| + | <div style="font-weight:300;margin-bottom: 60px;margin-top:15px;max-width:700px;margin-left:15px;font-family:HelveticaNeue-Light, Helvetica Neue Light, Helvetica Neue, Helvetica, Arial, Lucida Grande, sans-serif;font-size:17px;> | ||
| + | [[File:yc static join table.png|500px]]<br> | ||
| + | |||
| + | Drag both <i>StaticSensorReadings.csv</i> and <i> StaticSensorLocations.csv</I> into the Tableau Data Source. A inner joined Data source is generated. 2 sets of data joined perfectly with common columns. | ||
| + | </div> | ||
| + | |||
| + | == <div style="font-weight:300;padding: 10px 13px 20px 13px; line-height:10px;font-family:HelveticaNeue-Light, Helvetica Neue Light, Helvetica Neue, Helvetica, Arial, Lucida Grande, sans-serif;font-size:25px">Combine Static Sensor Data</font></div>== | ||
<div style="font-weight:300;margin-bottom: 60px;margin-top:15px;max-width:700px;margin-left:15px;font-family:HelveticaNeue-Light, Helvetica Neue Light, Helvetica Neue, Helvetica, Arial, Lucida Grande, sans-serif;font-size:17px;> | <div style="font-weight:300;margin-bottom: 60px;margin-top:15px;max-width:700px;margin-left:15px;font-family:HelveticaNeue-Light, Helvetica Neue Light, Helvetica Neue, Helvetica, Arial, Lucida Grande, sans-serif;font-size:17px;> | ||
Revision as of 19:48, 12 October 2019
Provided Data:
- MobileSensorReadings.csv - contains the sensor readings of different mobile sensor Ids over a period of time and its locations
- StaticSensorReadings.csv - contains the sensor readings of different static sensor Ids over a period of time
- StaticSensorLocations.csv - contains the different static sensor Ids with its locations
I will start with importing Mobile Sensor Data and then Static Sensor Data.
Create Mobile Sensor Map Graph
a. Drag Long and Lat into Columns and Rows respectively.
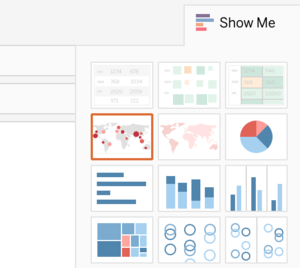
b. Go to the top right corner and click Show Me, select symbol maps
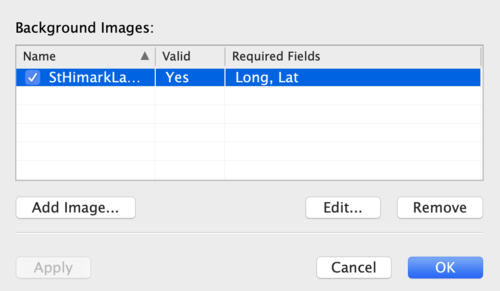
c. Now, the background of the map is not defined. To customise the background, go to the top menu bar and select Map and then Background Images
d. Click Add Image and locate the image file on your computer.
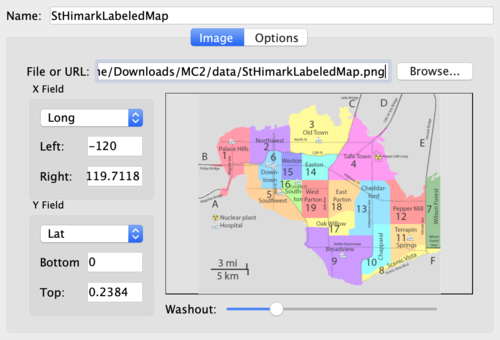
e. To map the background perfectly, set the correct Long and Lat limits accordingly. Adjust the transparency using Washout slider and then click Okay.
3. xxx
Drag both StaticSensorReadings.csv and StaticSensorLocations.csv into the Tableau Data Source. A inner joined Data source is generated. 2 sets of data joined perfectly with common columns.
4. xxx
Drag both StaticSensorReadings.csv and StaticSensorLocations.csv into the Tableau Data Source. A inner joined Data source is generated. 2 sets of data joined perfectly with common columns.
5. xxx
Drag both StaticSensorReadings.csv and StaticSensorLocations.csv into the Tableau Data Source. A inner joined Data source is generated. 2 sets of data joined perfectly with common columns.


