IS428 AY2019-20T1 Assign Ho Jue Hong Dashboard
Jump to navigation
Jump to search
DASHBOARD LINK'
https://public.tableau.com/profile/ho.jue.hong#!/vizhome/JueHong_MC2_Dashboard1/Dashboard1
https://public.tableau.com/profile/ho.jue.hong#!/vizhome/JueHong_MC2_Dashboard2/Dashboard2
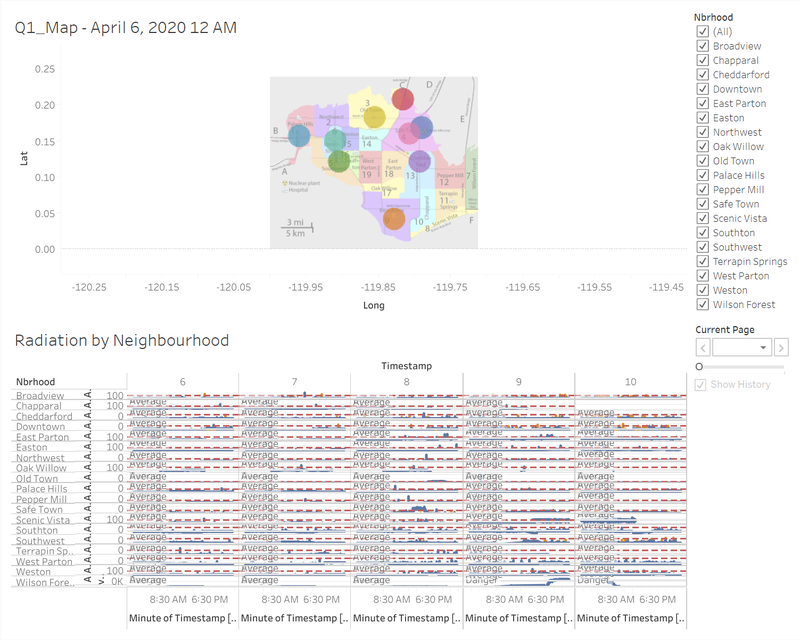
Neighbourhood Radiation Analysis
1. Uses two filters 1st is the neighbourhood you would like to analyze
2. 2nd Filter is the timestamp where you can go through the time series data to visualise the changes overtime.
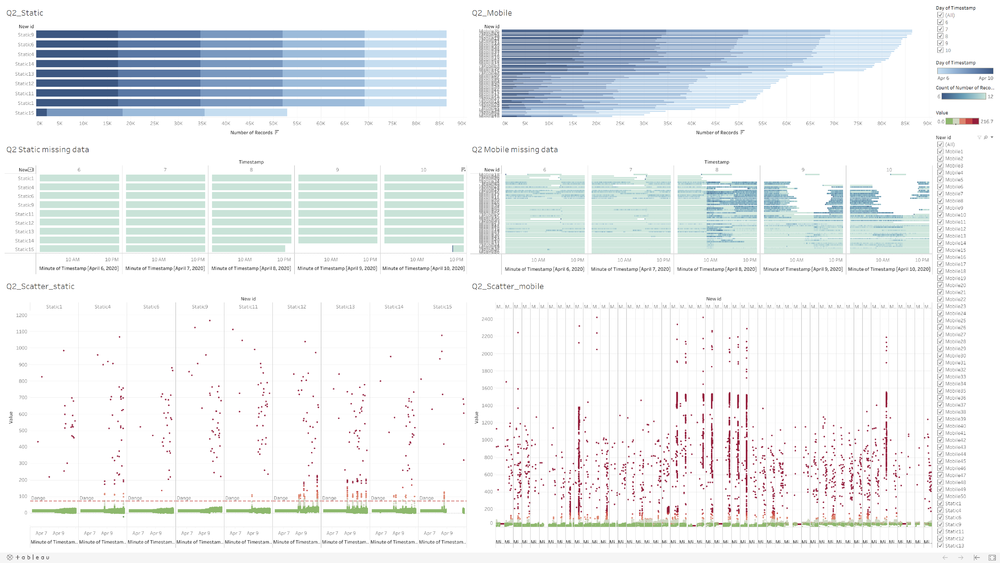
Sensor Analysis
1.First Filter is Time stamp of the dates where you can zoom in to each static dataset to look the individual data
2.Second filter shows the sensors ID. You can choose which sensor you want to use and analyse. Essentially the value reading it gives or the loss of data.


