IS428 AY2019-20T1 Assign Goh Jia Xian
Vast Challenge 2019, Mini-Challenge 1: Crowdsourcing for Situational Awareness
Contents
Overview
St. Himark has been hit by an earthquake, leaving officials scrambling to determine the extent of the damage and dispatch limited resources to the areas in most need. They quickly receive seismic readings and use those for an initial deployment but realize they need more information to make sure they have a realistic understanding of the true conditions throughout the city.
In a prescient move of community engagement, the city had released new damage reporting mobile application shortly before the earthquake. This app allows citizens to provide more timely information to the city to help them understand damage and prioritize their response.
Objective
With emergency services stretched thin, officials are relying on citizens to provide them with much-needed information about the effects of the quake to help focus recovery efforts. By combining seismic readings of the quake, responses from the app, and background knowledge of the city, help the city triage their efforts for rescue and recovery.
- Emergency responders will base their initial response on the earthquake shake map. Use visual analytics to determine how their response should change based on damage reports from citizens on the ground. How would you prioritize neighbourhoods for response? Which parts of the city are hardest hit? Limit your response to 1000 words and 10 images.
- Use visual analytics to show uncertainty in the data. Compare the reliability of neighbourhood reports. Which neighbourhoods are providing reliable reports? Provide a rationale for your response. Limit your response to 1000 words and 10 images.
- How do conditions change over time? How does uncertainty in change over time? Describe the key changes you see. Limit your response to 500 words and 8 images.
- The data for this challenge can be analyzed either as a static collection or as a dynamic stream of data, as it would occur in a real emergency. Describe how you analyzed the data - as a static collection or a stream. How do you think this choice affected your analysis? Limit your response to 200 words and 3 images.
Useful information from “St. Himark - About Our City”
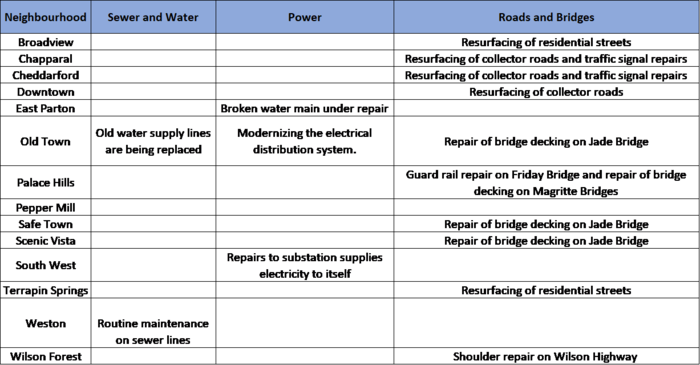
From the description about St. Himark, we can come to gather some useful information about the city’s infrastructure. These are the on-going projects in the following neighbourhoods to improve its infrastructure:
The above-mentioned projects may affect the scores on damages reported by the citizens on the mobile application.
Data Preparation
Upon looking through mc1-reports-data.csv, the file simply contains the scale of the damage (Building, Medicine, Sewage and Water, Power and Roads and Bridges) and Shake Intensity reported by a Rumble user from a specific neighbourhood specified as location (integer). The data provided is ‘user-friendly’ for me to work with but I will need to create new columns in the data file to provide more information to the charts.
| Problem #1 | No Unique Identifier |
|---|---|
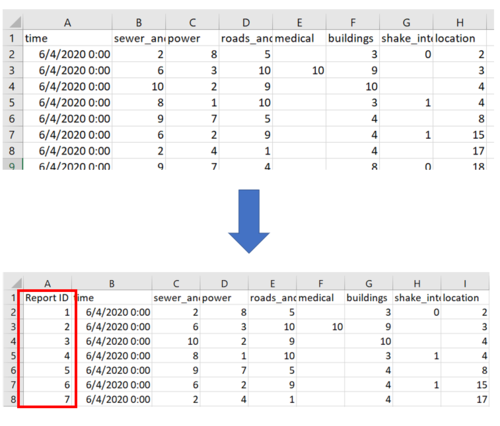
| Issue | Each row in mc1-reports-data.csv is a unique report received from Rumble mobile application’s user. However, each row does not contain a Unique Identifier (ID) to distinguish each report. Without an ID, it may result in data inaccuracy as I proceed to data manipulation or chart creation. |
| Solution |
| Problem #2 | Poor Location Description |
|---|---|
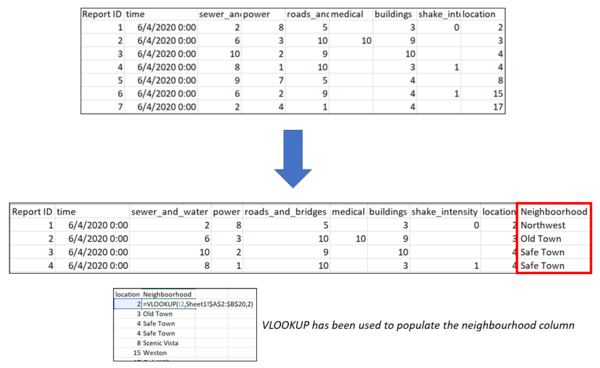
| Issue | The data file provided identifies each location via Location (number) which is not human-readable in understanding where the location, it lacks a name description about the neighbourhood. |
| Solution |
| Problem #3 | St. Himark Shapefile Provided Does Not Fill Background Map |
|---|---|
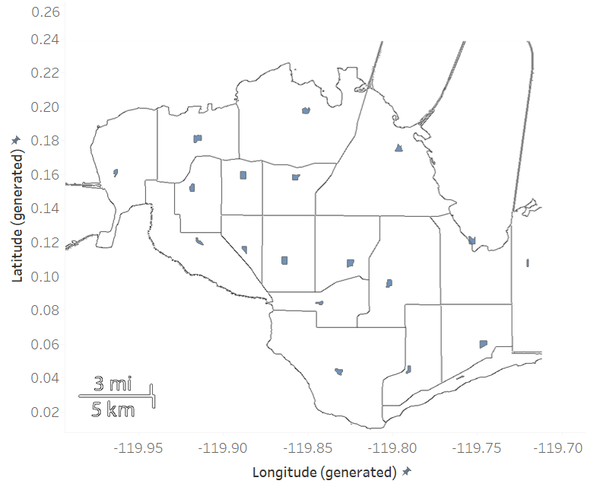
| Issue | Having tried to use the shapefile that has been provided in mini-challenge 2 together with a background image, the polygon does not fully fill the image and it looks like points on the map as shown below.
StHimarkNeighborhoodMapNoLabels.png from MC2 has been redesigned to achieve the above background
|
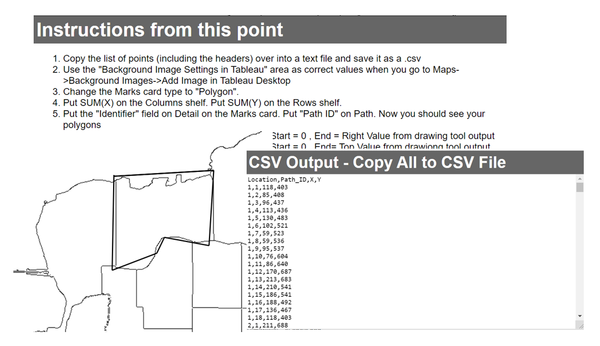
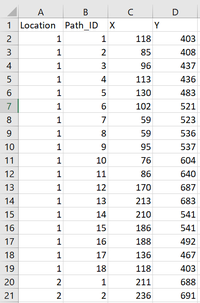
| Solution | Using this HTML tool downloaded from https://github.com/bryantbhowell/tableau-map-pack/blob/master/draw_tableau_polygons_on_background_image.html, I have managed to manually plot the polygons and generated a 'Neighbourhood Polygon.csv'. Now, the polygons have successfully fill in the background map.
Screenshot of the downloaded tool
Snippet of the csv generated
|
Importing Data into Tableau
Data Files to be Imported:
I will be working with the following data files:
- mc1-reports-data.csv - Data of damage/shake intensity reported by Rumble users with updated fields
- Neighbourhood_Polygon.csv - Data containing the polygon of each neighbourhood
Connecting the data files
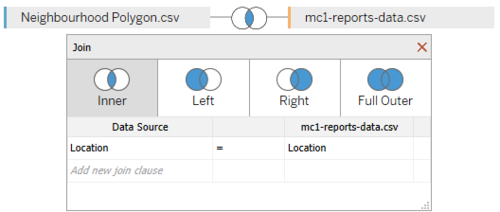
Before I may begin using the data to plot to generate my charts and dashboards, I need to import the above-mentioned data files and create a relationship between these data sources in Tableau (as shown below).
Additional Data Transformation in Tableau
| Measure Created | Purpose |
|---|---|
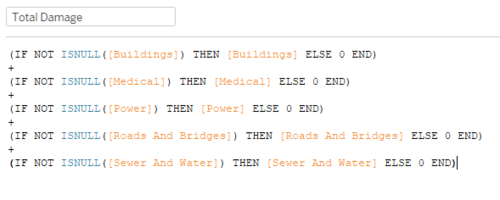
| Total Damage (Measure) | To distinguish the neighbourhood that has been hit the hardest across |
Dashboard - Interactive Visualisation
My interactive visualization dashboard can be accessed here: https://public.tableau.com/profile/goh.jia.xian#!/vizhome/GohJiaXian-IS428AssignmentMC1Dashboard/Homepage
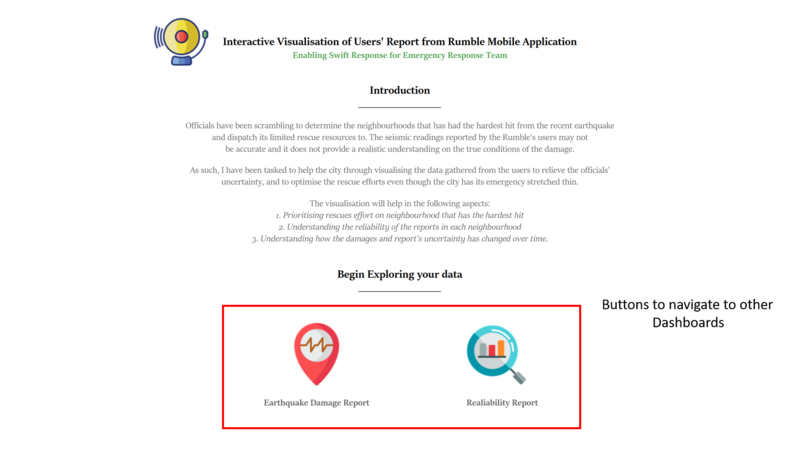
In my visualisation, you will find three interactive dashboards - Homepage, Earthquake Damage Report and Reliability Report - where users can use to perform analysis on. The charts within the dashboards have been designed to be highly interactive to enhance your visualisation analysis' needs and it allows you to drill down your information into a granular level. Allow me to explain the dashboards in greater details below:
| Homepage (Landing Page) |
|---|
| Description of this dashboard The homepage acts as the landing page when you first access my dashboards created in Tableau. It first introduces you to the background of the problem that the dashboard is helping to resolve and explain how this dashboard has been designed to tackle the problems. The data exploratory tools are displayed on the bottom of the page where you can click on them to navigate to the dashboard that you desire to begin your data exploration. |
Interactive Technique Used
|
| Earthquake Damage Report |
|---|
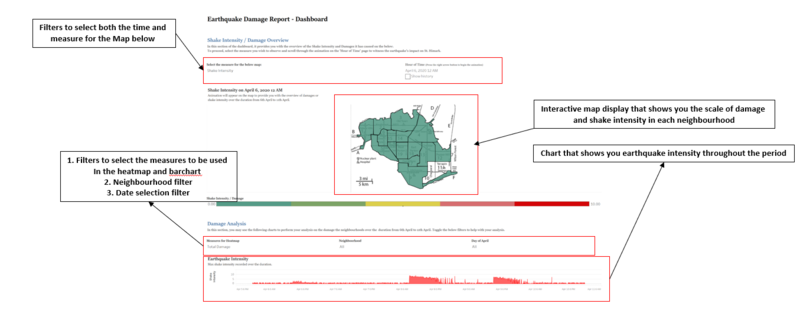
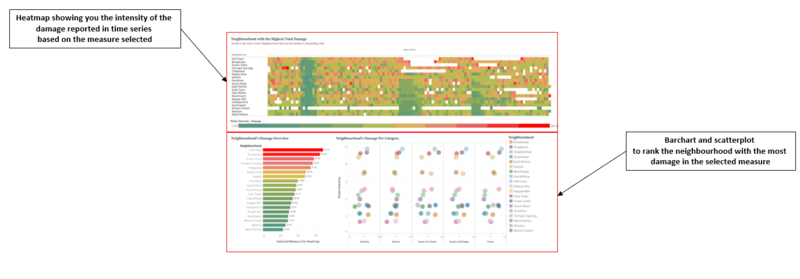
| Description of this dashboard This dashboard has been designed to help you to visualise the shake intensity and damages that have been experienced by St. Himark. The first section provides you with the tools you need to visualise the damage and shake that has occurred through the animation. In the bottom section, it provides you with a time series information of damages on a granular level, you may use the heatmap to identify the time period with the highest level of damage/shake intensity reported in each neighbourhood. The barchart and scatterplot helps you rank the neighbourhoods that may be needed to prioritise in the rescue efforts. |
Interactive Technique Used
|
| Reliability Report |
|---|
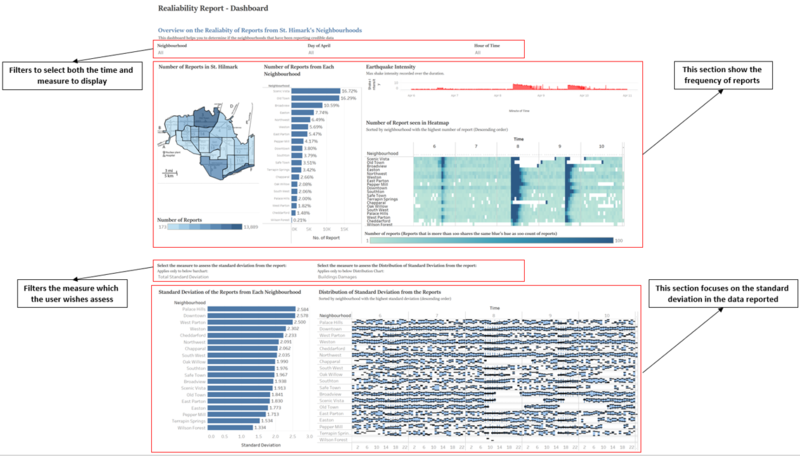
| Description of this dashboard The reliability report's dashboard primarily shows you the frequency of report and standard deviations of the data reported by the users. It allows user to assess the neighbourhoods that are more credible in their reporting in every category.
|
Interactive Technique Used
|
Task 1
Emergency responders will base their initial response on the earthquake shake map. Use visual analytics to determine how their response should change based on damage reports from citizens on the ground. How would you prioritize neighbourhoods for response? Which parts of the city are hardest hit? Limit your response to 1000 words and 10 images.
1.1. The Hardest Hit Neighbourhood
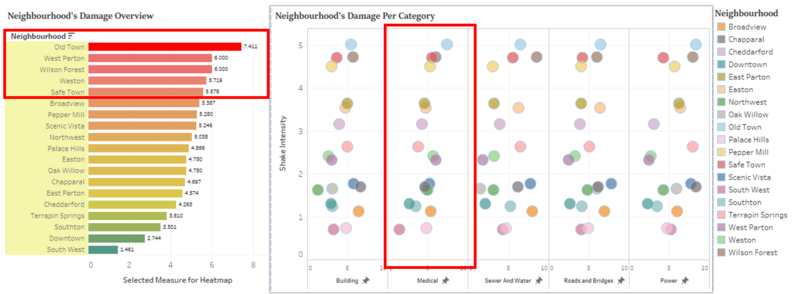
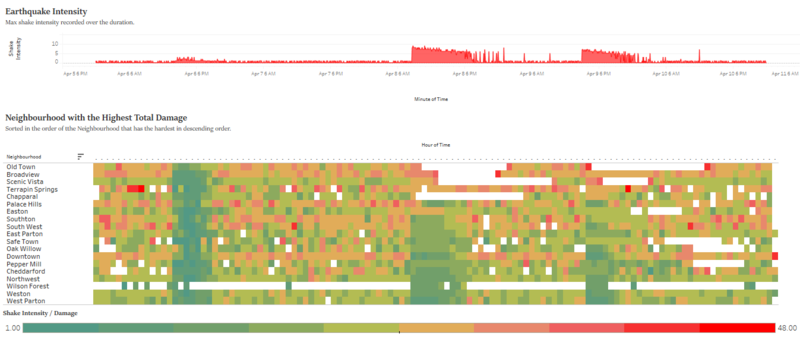
According to the shake intensity reported across the neighbourhoods, the concern of needing more information to triage rescue efforts by the authorities of St. Himark has been proven to be true. The below image shows the reported value of shake intensity by each neighbourhood and the order is as follows – 1. Old Town, 2. Wilson Forest, 3. Safe Town, 4. Pepper Mill and 5. East Parton.
Now, we look at the overall damage that each neighbourhood has received over the 6 days, we are able to deduce that the following neighbourhoods with the hardest hit with a high level of damages across its infrastructure and facilities, the neighbours are as follows - 1. Old Town, 2. Broadway, 3. Scenic Vista, 4. Terrapin Springs and 5. Chapparal - as shown in the below image.
Upon comparison, the discrepancies became obvious that neighbourhoods that reportedly experienced a high level of shake intensity need not be prioritised for emergency rescue and recovery effort. As such, we will proceed to analyse the damage and prioritise the rescue effort in accordance with the order of priority explained by the DirectRelief on fundamentals of emergency response.
1.2. How would I prioritise neighbourhood response?
According to DirectRelief, a humanitarian aid organisation, the fundamentals of emergency response in prioritising earthquake rescue is as follows:
- Saving lives. Perform search and rescue to immediately provide emergency first aid and medical services to the injured persons or the person who may be trapped in a collapsed building.
- Identify nearest undamaged medical facilities. Medical institutions may be damaged by the earthquake, authorities need to know the nearest medical facilities to attend to the injured person while taking into the facilities’ capacity and resources.
- Provide basic necessities such as water, shelter and sanitisation to displaced persons. The first 72 hours should be prioritised for search and rescue efforts, thereafter, an arrangement of basic necessities must take precedence as victims may eventually become ill due to the lack of necessities.
- Ensure that roads and electrical infrastructures do not impede relief efforts due to poor logistical distribution. With damaged infrastructure, it will create bottlenecks in relief efforts and delay the process of recovery.
As such, based on the data provided in mc1-report-data.csv, the emergency response team needs to assess the shake intensity and damages of each neighbourhood in this order:
- buildings – High buildings damages may infer that there collapsed buildings and this poses an imminent threat to the victims’ mortality.
- medical – Medical facilities are important to provide immediate treatment to the victims, authorities need to identify the neighbourhood that has its medical facilities damaged. They need to arrange transport to send victims to the nearest medical facilities in other neighbourhoods.
- sewer_and_water – The neighbourhood with the hardest hit on its sewer and water systems must be responded to as victims will fall ill from the lack of these basic necessities.
- roads_and_bridges - Identify the neighbourhood with the highest damage to its transportation network which will impede relief effort. Recovery effort for these infrastructures must be executed to remove any delays in providing humanitarian aid’s supplies to the victims.
- power – Authorities should restore the power system to reinstate the neighbourhood back to its normal state.
Before we begin to look into the damages in each category, we should first filter the dates beginning from the first major quake until the end of the second quake to analyse the damages that have been caused by the earthquake. I have filtered dates through my heatmap to begin assessing the damage.
Critical Factors for Immediate Response
1. Drilling into Building Damages:
Based on the highest average building damage in each neighbourhood, we can determine that the following neighbourhood requires the emergency’s team immediate attention – 1. Chapparal, 2. Broadview, 3. Old Town, 4. Scenic Vista and 5. Wilson Forest.
There is an interesting finding from the analysis on the high building damage in Chapparal as it did not experience a high level of shake intensity. Upon looking into this neighbourhood, we can tell that the buildings are not earthquake-proof as it is a rural area with 18th and 19th century’s farmhouses. Likewise to the buildings in Broadview, most buildings are made by Mansory construction which could be explained to be unreinforced to withstand earthquakes.
2. Drilling into Medical Damages: The highest average medical damages in each neighbourhood are 1. Old Town, 2. West Parton, 3. Wilson Forest, 4. Weston and 5. Safe Town.
Amongst this neighbourhood, only Old Town has a hospital situated in it. Hence, its Medical facilities could be damaged and authorities need to relocate existing patients and injured persons to either Eaglepeak Hospital in Southon or Trauma Hospital in Downtown. All plans for patient transfer to Old Town Hospital should be revised and reassessed.
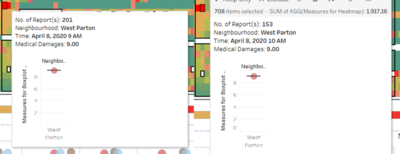
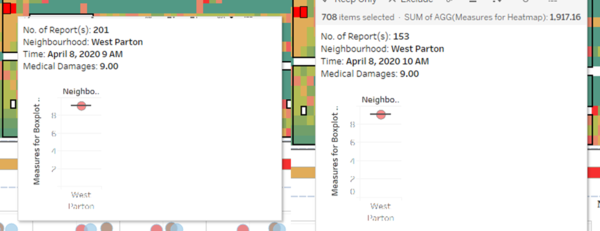
Moreover, the authorities need to send its response team to West Parton as there is high damage of scale 9 reported by 201 people on 8th April, 9am and a scale 9 damage at 10am by 153 people.
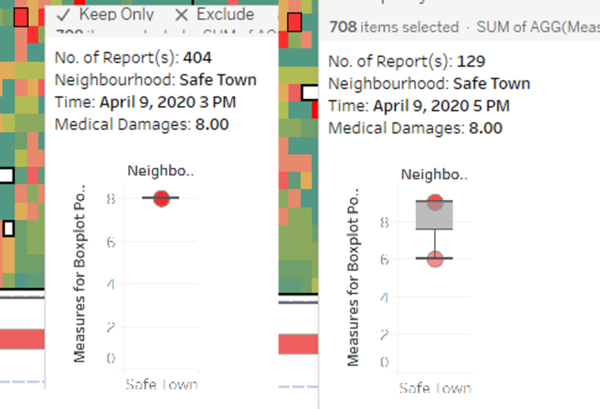
Likewise, the response team needs to be sent to Safe Town as they have reported a scale 8 damage on 9th April, 3pm and 5pm by 404 and 129 people respectively.
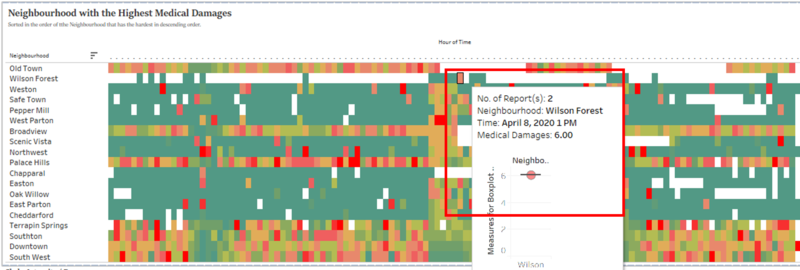
However, upon looking into Wilson Forest, there may be an inaccuracy the data report as there were only two reports made on April 8, 2020 1pm with a scale of level 6 damage for medical. Otherwise, most of the data reported on medical damage are low as shown in the image below.
Non-Critical Factors for Immediate Response that will take precedence for long-term effort
3. Drilling into Sewer and Water Damages: The highest average medical damages in each neighbourhood are 1. Wilson Forest, 2. Scenic Vista, 3. Broadview, 4. Old Town and 5. Terrapin Springs.
4. Drilling into Roads and Bridges Damages: The highest average medical damages in each neighbourhood are 1. Scenic Vista, 2. Old Town, 3. Broadview, 4. Easton and 5. Chapparal.
5. Drilling into Power: The highest average medical damages in each neighbourhood are 1. Chapparal, 2. Old Town, 3. Wilson Forest, 4. Terrapin Springs and 5. Scenic Vista.
As such, the locations that require immediate rescue efforts are Old Town, Broadview, Scenic Vista, Safe Town and West Patron.
Task 2
Use visual analytics to show uncertainty in the data. Compare the reliability of neighbourhood reports. Which neighbourhoods are providing reliable reports? Provide a rationale for your response. Limit your response to 1000 words and 10 images.
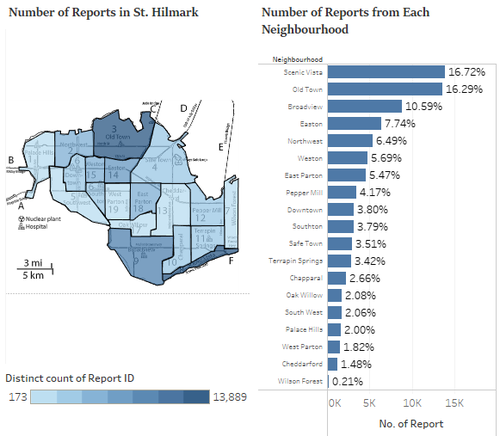
In the previous question, we have identified 1. Old Town, 2. Broadway, 3. Scenic Vista, 4. Terrapin Springs and 5. Chapparal have experienced the highest level of damage from the earthquake, and authorities should prioritise these neighbourhoods for its rescue efforts. Before that, let us have a better understanding of the number of reports reported in these neighbourhoods over the duration and observe the image below.
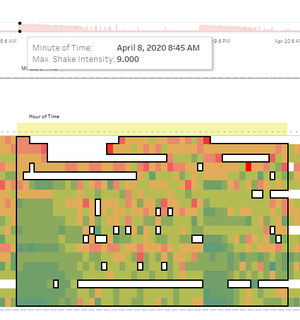
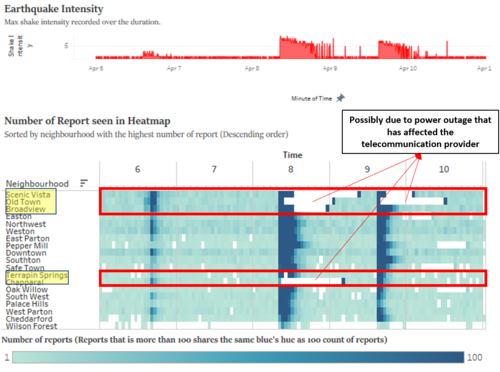
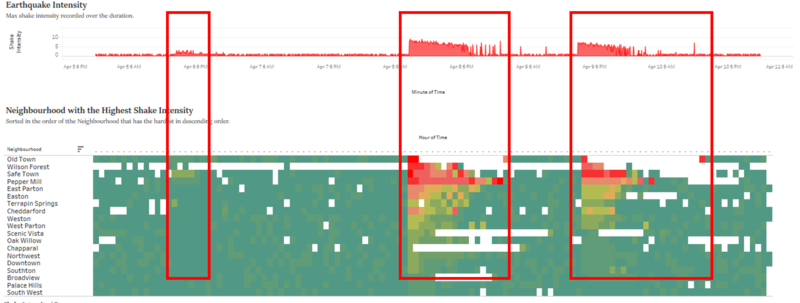
Amongst the neighbourhoods that have reported a high level of damage, the following neighbourhoods Scenic Vista (16.72%), Old Town (16.29%), Broadview (10.59%) provided a cumulative of 43.6% of the total number of the report (83,070). Other the other hand, Terrapin Springs (3.42%) and Chapparal (2.66%) provided a much lesser number of reports. Upon looking at the below image, we can observe a pattern that there will be a spike in the report when tremor is felt. Based on the heatmap, we can identify an incident of power outages that have affected this neighbourhood except for Terrapin Springs. Once the power has been restored, a high volume of reports can be observed and these reports may not be reliable as it is has been accumulated during the period of a power outage – spikes in shake intensity as highlighted in the image coincides with restored power supply. As such, we need to take note of high deviation in the reported values for this neighbourhood.
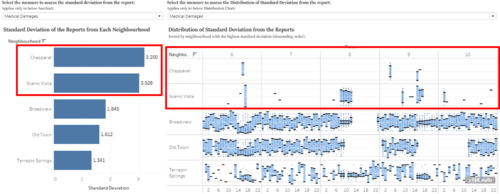
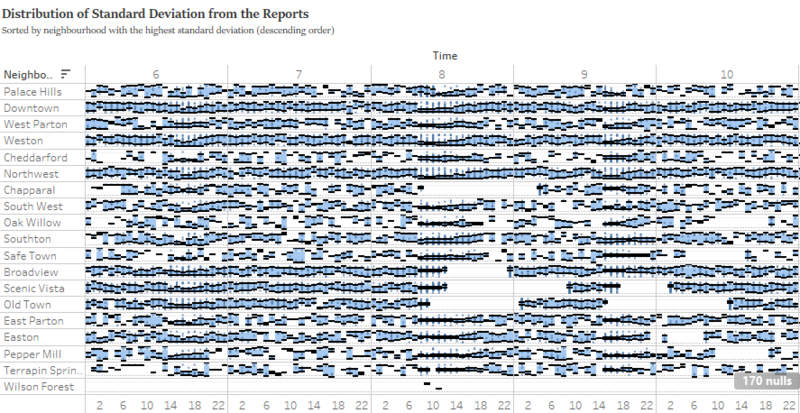
As such, we proceed to use standard deviation charts to evaluate the spread of the data from its mean. Through using the standard deviation bar chart found in the ‘Reliability Report – Dashboard’ to understand the spread of the reported data in each category from the highly damaged neighbourhoods, we can understand that Both Chapparal and Scenic Vista’s reported values for Medical Damages have a standard deviation of more than 3. Making the data unreliable, upon looking at the Distribution of standard deviation, we can identify that there is a lack of data reported from both neighbourhood and the reported values have a widespread.
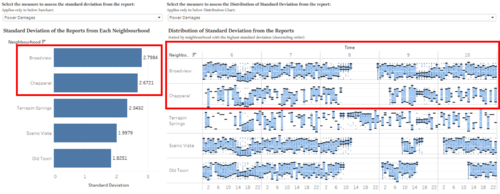
Upon further investigations into other categories, we can observe a high standard deviation in power damages reported by Broadview and Chapparal as shown in below image. We can observe a high spread on power damage reported from these neighbourhoods consistently through the duration from 6th to 10th April. As Chapparal has one of the highest Power Damage as shown in Question 1’s analysis on the Power Damage, it may not be as reliable as it seems and the rescue team should prioritise its recovery effort in other categories.
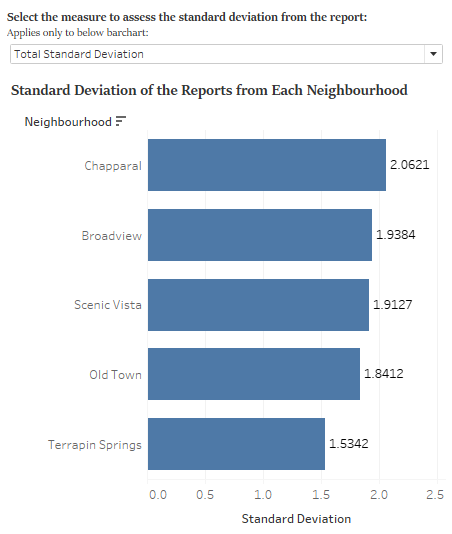
Lastly, using Standard Deviation chart once more to compare the standard deviation across all categories, we can determine that Terrapin Springs, Old Town and Scenic Vista are more realiable neighbourhood in damage reporting.
Task 3
How do conditions change over time? How does uncertainty in change over time? Describe the key changes you see. Limit your response to 500 words and 8 images.
Shake Intensity Observations
Based on the image below, we can determine that the first quake happened on 6th April, at 2.30am where the tremor could be felt by the neighbourhood near the earthquake's epicenter (Old Town, Safe Town and Wilson Forest. There were no reports of high intensity between 6th and 7th April until 8th April, 8.45am where the first major quake happened and the last quake happened on 9th April, 3.15pm.
Patterns in Damage
According to the heat map that visualises the total damage during the duration from 6th to 11th April. We can observe that there is no unique pattern in reporting the damage prior to the major earthquake. Consistently, Rumble users are using the application to share the damage of the facilities in the neighbourhood. Moreover, there is no change in pattern in reported damages even after the first two earthquakes,
Change in Uncertainty
Based on the distribution of standard deviation in reports, we can observe an increase in certainty during the period of the earthquake. The distribution of standard deviation drastically closes in on itself on both major quakes that happened on the 8th and 9th April, this could be explained by the increase in the number of reports. Thereafter, the reliability of the data decreases as the standard deviations increase once the natural phenomenon has stopped.
References
https://en.wikipedia.org/wiki/Unreinforced_masonry_building
https://www.doingdata.org/blog/how-to-create-jitter-plot-strip-plot-in-tableau
https://www.directrelief.org/fundamentals-emergency-response/
https://www.tableau.com/learn/tutorials/on-demand/background-images-8
