File:Issue1.png
Jump to navigation
Jump to search
Size of this preview: 800 × 195 pixels. Other resolutions: 320 × 78 pixels | 1,022 × 249 pixels.
Original file (1,022 × 249 pixels, file size: 96 KB, MIME type: image/png)
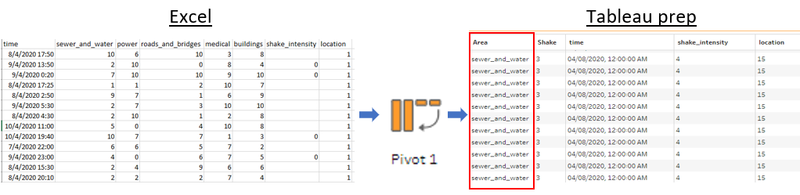
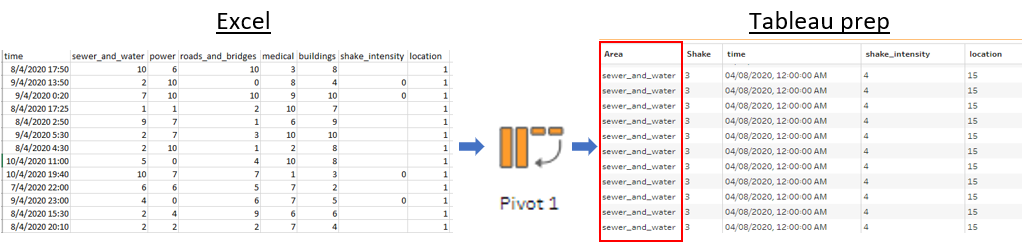
Issue: The report data provided the shake intensity of various facilities in their specific rows, making analysis by various facilities difficult. Solution: Data cleaning was performed to pivot the various facilities into a single column called Area using Tableau Prep. By doing so, the shake intensity can be filtered and visualized according to the various areas.
File history
Click on a date/time to view the file as it appeared at that time.
| Date/Time | Thumbnail | Dimensions | User | Comment | |
|---|---|---|---|---|---|
| current | 19:38, 6 October 2019 | 1,022 × 249 (96 KB) | Anne.lee.2017 (talk | contribs) |
- You cannot overwrite this file.
File usage
The following page links to this file: