ISSS608 2018-19 T1 Assign HyderAli Task 1 Insights
|
|
|
|
|
To investigate the official air quality PM10 composition between 2013 and 2018, we proceed to consolidate the daily and hourly data in Sofia City from the following datasets:
- Official Air Quality Measurements - 6 Air Quality Stations
- Meteorological Measurements: Temperature, Humidity, Wind Speed, Pressure, Rainfall and Visibility from 6 Air Quality Stations
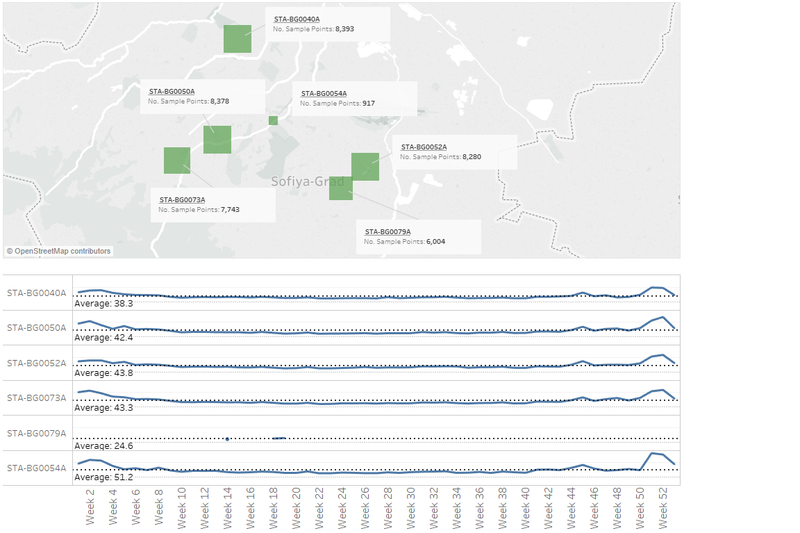
The consolidated data consists of 39,715 measurements from the 6 stations: BG0040A - 8393, BG0050A - 8378, BG0052A - 8280, BG0073A - 7743, BG0079A - 6004 and BG0054A - 917.
| EEA Data - Official Air Quality Measurements | EEA Metadata | Meteorological Measurements |
|---|---|---|
| Country Code Namespace Air Quality Network Air Quality Station Air Quality Station EOI Code Sampling Point Sampling Process Sample Air Pollutant Averaging Time Concentration Unit of Measurement Datetime Begin Datetime End Validity Verification |
Country Code Namespace Air Quality Network Air Quality Station Air Quality Nat Code Air Quality Station EOI Code Air Quality Station Area Sampling Point Sampling Process Sample Building Distance Equivalence Demonstrated Inlet Height Kerp Distance Measurement Equipment Measurement Type Measurement Method Air Pollutant Code Air Pollutant Air Quality Station Type Projection Longitude Lattitude Altitude |
Year Month Day TASMAX TASAVG TASMIN DPMAX DPAVG DPMIN RHMAX RHAVG RHMIN sfcWindMAX sfcWindAVG sfcWindMIN PSLMAX PSLAVG PSLMIN PRCPMAX PRCPAVG PRCPMIN VISIB |
Characterize the past and most recent situation with respect to air quality measures in Sofia City. What does a typical day look like for Sofia city? Do you see any trends of possible interest in this investigation? What anomalies do you find in the official air quality dataset? How do these affect your analysis of potential problems to the environment? Your submission for this questions should contain no more than 10 images and 1000 words.
Contents
Air Pollution Levels in Sofia City: From 2013 to 2018
The time-series data between 2013 and 2018 contains a mixture of both daily and hourly measurements across the 6 stations, with no data between Jan-17 to Oct-17. The daily average PM10 concentration is highly fluctuating with an average concentration of 42.1μg/m3, below the limit value of 50μg/m3. The highest peak was recorded on 22-Dec-2013 with an average concentration of 354.4 μg/m3, with other peaks towards the end of the year. Moreover the overall trend was decreasing over the years between 2013 and 2018; could the decreasing trend be representative of the efforts made by the citizens/government of Sofia City in meeting their long-term objectives of cleaner air?

A Day in Sofia - 14 Sep 2018
Sampling the hourly data on one of the least polluted days, on 14-Sep-2018, the hourly average PM10 concentration averages to approximately 21.27μg/m3; rising above the average line in the morning (between 4am to 9am) and then falling below the average line during the later part of the day (between 10am to 5pm).

Does Sofia's Air Quality Get Worse in Winter?
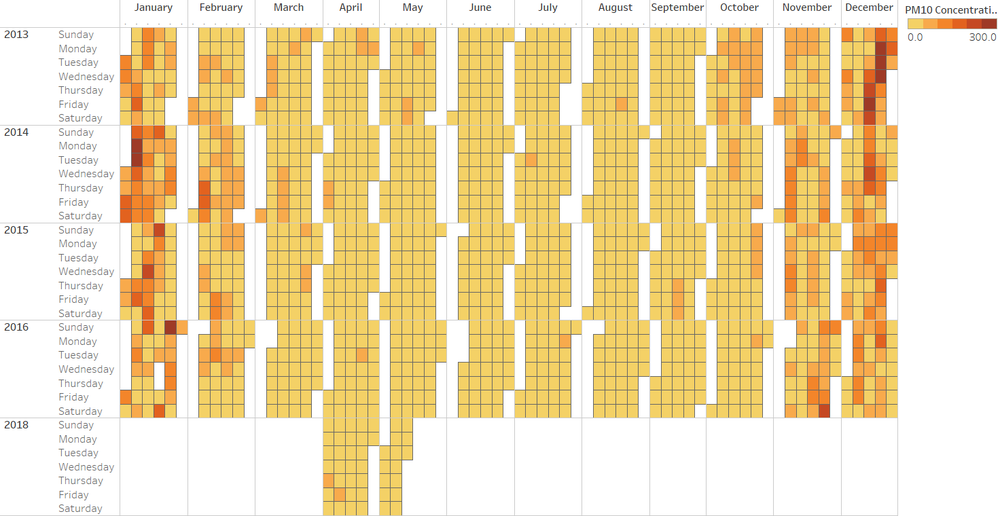
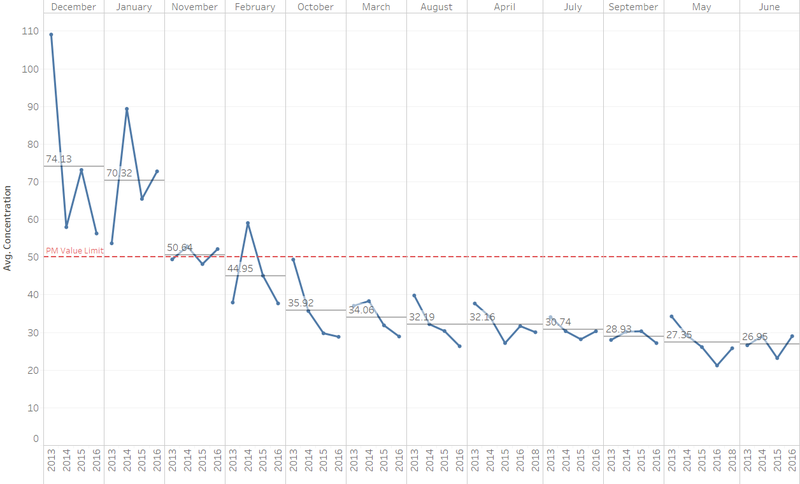
PM10 pollutant levels were highest and above the 50-limit during November, December and January periods. The average concentration levels across the years were 74.13, 70.32 and 50.64 μg/m3 respectively. The intensity of the pollutant levels was also obvious from the heatmap calendars during the December and January periods. A possible cause of high pollution levels during the winter periods could be due to a temperature inversion;low temperatures and stagnant air during cold seasons have a way of creating a build-up of particulate matter near the ground whereby cold air is trapped near the ground by a layer of warm air which then acts like a lid and thus holding these substances down.


Has the Trend changed over the years?
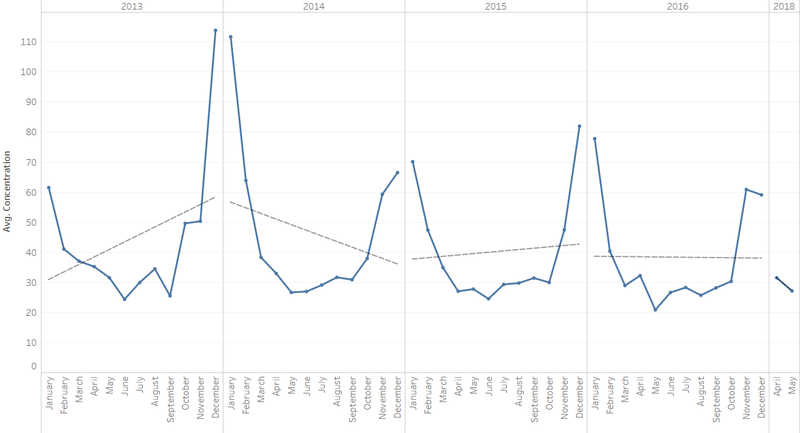
Trend of PM10 pollutant levels were positive in years 2013 and 2015. Likewise the trend was decreasing in 2014 with an overall stagnant growth in 2016. Overall, the trend was slightly decreasing between 2013 to 2018. The overall decreasing trend could be attributed to outreach programs and voluntary actions by individuals/organizations which aim to educate about health effects and sources of air pollution so as to reduce the overall pollution levels.

Day-of-Week Patterns of PM10 Levels
It is quite useful to analyze variations by day of week in the PM10 concentration data. The highest recorded PM10 concentration occurred on Thursday (42.08 μg/m3) whilst the lowest recorded PM10 concentration occurred on Saturday (38.31 μg/m3). The PM10 concentrations exhibited a general weekly pattern, with the maximum occurring late in the workweek and the minimum occurring on weekends (especially Saturday); this pattern prevails at all Air Quality Station sites. Some researchers have postulated that the higher pollution levels on weekdays could be attributed by higher traffic of heavy-duty vehicles, which represent a major source of elemental carbon.

Locations of Particulate Matter Monitoring Sites
As the levels of PM10 were measured in 6 different stations at the city of Sofia, we proceed to evaluate the association between the particulate matter levels and the spatial locations. The measurements showed that the PM10 concentrations in the stations were between 24.6 and 51.2 μg/m3. All measurements were recorded near the center of Sofia City based on the spatial locations of the 6 stations. The highest recorded average PM10 concentration of 51.2 μg/m3 belonged to STA-BG0054A, which recorded only 917 (2.3%) out of 39,715 measurements. Measurement Records from STA-BG0040A (21.1%), STA-BG0050A (21.1%), STA-BG0052A (20.8%) and STA-BG0073A (19.5%) were well distributed and recorded an average PM10 concentration level below the PM-50 limit. It was also worthwhile to observe that the measurements from STA-BG0079A (15.1%) recorded measurements only during the weeks 14, 18 and 19 over the years with an average of 24.6 μg/m3. Thus, the pollutant level measurements do depend on how rural/urban the sampling site is. The air-quality measures generally suggest that air quality improves as areas become more rural (or less urban) due to decreased human activity and lesser peak vehicle traffic.

