ISSS608 2018-19 T1 Assign Chen Jingyi Task 3
|
|
|
|
|
|
Contents
Discover relationships
In this task we join 'Meteorological measurements' with 'Citizen science air quality data' to explore hidden relationships behind indicators.
PM10 & PM2.5
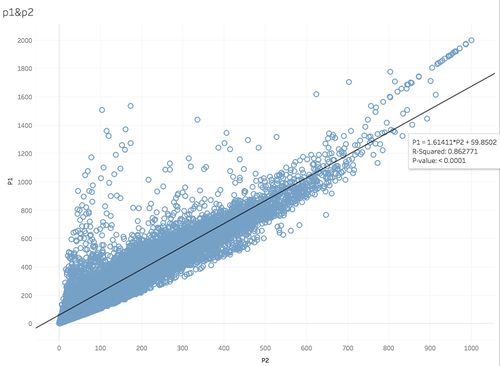
From taks2 we already know that PM 10 and PM 2.5 follows the same trend over time, here we furthur explore the linear trend of these 2 variables, and the result is shown below. The p-value and R squared value indicates that the model is able to explain the majority of observations, which means these measurements are highly related with each other. In later analysis, we will only use PM10 value to examine its relationship with other variables since we can consider same result can be got if use PM2.5 instead.
Wind is really helpful
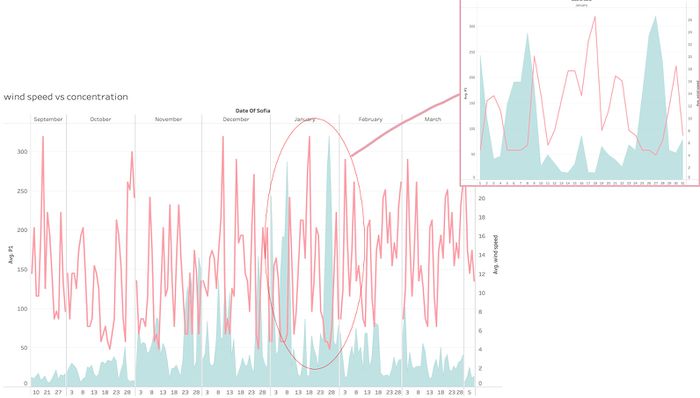
The graph below shows that wind is very useful at reducing concentration value: these 2 values have a reverse trend, when wind is low, concentration is usually high. This is especially significant in month with higher PM10 records, for example January.
Rainfall vs Temperature
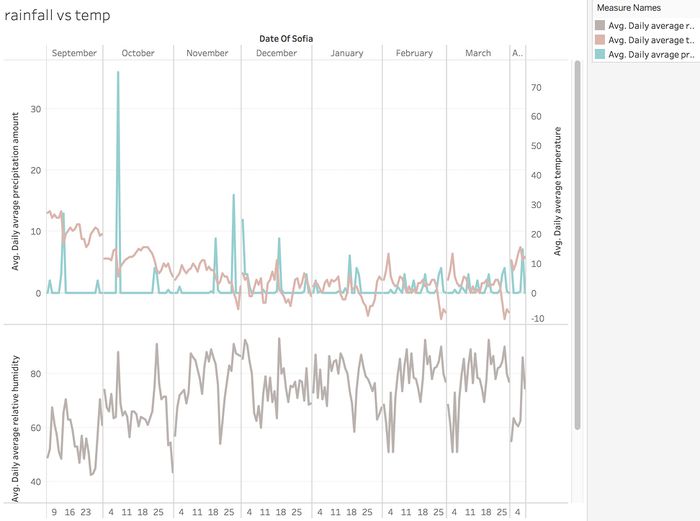
When there's huge rainfall, the temperature will definitely drop, sometimes with a slight lagging.
Combining together
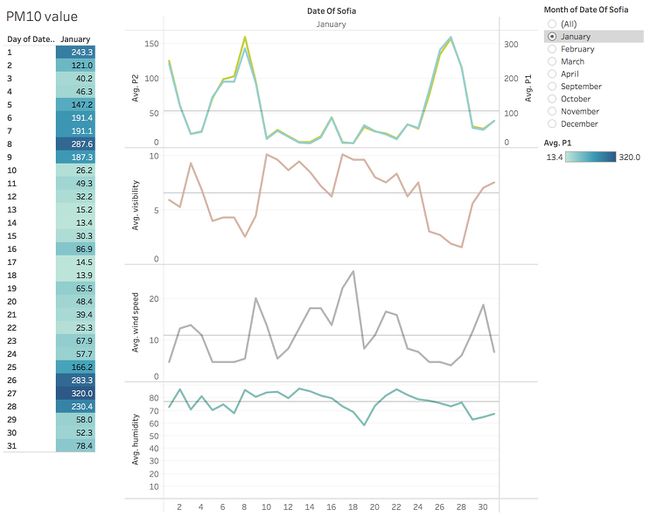
Put all these measurements in dashboard provides us with a clearer view. View dashboard here.


