ISSS608 2018-19 T1 Assign Choo Mei Xuan task3
|
|
|
|
|
|
Task 3
Urban air pollution is a complex issue. There are many factors affecting the air quality of a city. Some of the possible causes are:
Local energy sources. For example, according to Unmask My City, a global initiative by doctors, nurses, public health practitioners, and allied health professionals dedicated to improving air quality and reducing emissions in our cities, Bulgaria’s main sources of PM10, and fine particle pollution PM2.5 (particles 2.5 microns or smaller) are household burning of fossil fuels or biomass, and transport.
Local meteorology such as temperature, pressure, rainfall, humidity, wind etc
Local topography
Complex interactions between local topography and meteorological characteristics.
Transboundary pollution for example the haze that intruded into Singapore from our neighbours.
In this third task, you are required to reveal the relationships between the factors mentioned above and the air quality measure detected in Task 1 and Task 2. Limit your response to no more than 5 images and 600 words.
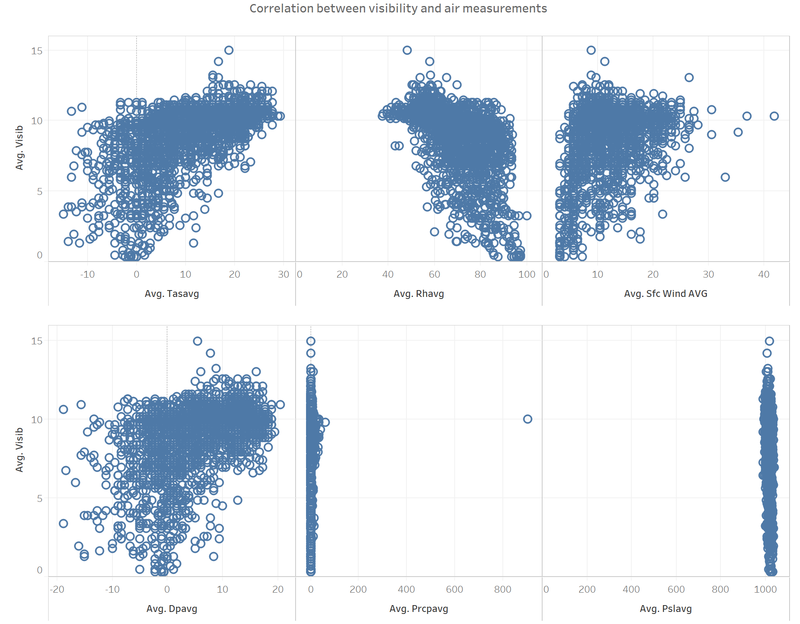
Figure 1. Correlation between visibility and air measurements
Using the meteorology data to investigate the relationships between average visibility and average temperature (Avg Tasavg), relative humidity (Avg Rhavg), daily average wind speed (Avg Sfc Wind Avg), daily average dew point temperature (Avg Dpavg), daily average precipitation amount (Avg Precpavg) and daily average surface pressure (Avg Pslavg).
Visibility is defined as the greatest distance at which a black object of suitable dimensions, situated near the ground, can be seen and recognised when observed against a bright background. [1]
As visibility is measured in Kilometres (km), outliers measurements of -9999 are removed.
It was found that lower visibility due to pollution has a direct correlation with increased rates of mortality in cities such as Hong Kong. [2] Zero visibility has been defined when visibility drops to less than 100metres (0.1km) and high visibility under extremely clean air in the Arctic can be up to 160km. [3]
Observations:
- Positive correlation between average temperature and visibility. As temperature increases, visibility improves
- Similar positive correlation between average dew point temperature and visibility.
- Negative correlation between average humidity and visibility. As humidity increases, visibility falls.
- Slight positive correlation between average wind speed and visibility. As wind speed increases, visibility improves.
- No correlation between average visibility and surface pressure and precipitation amount

